GUIDE
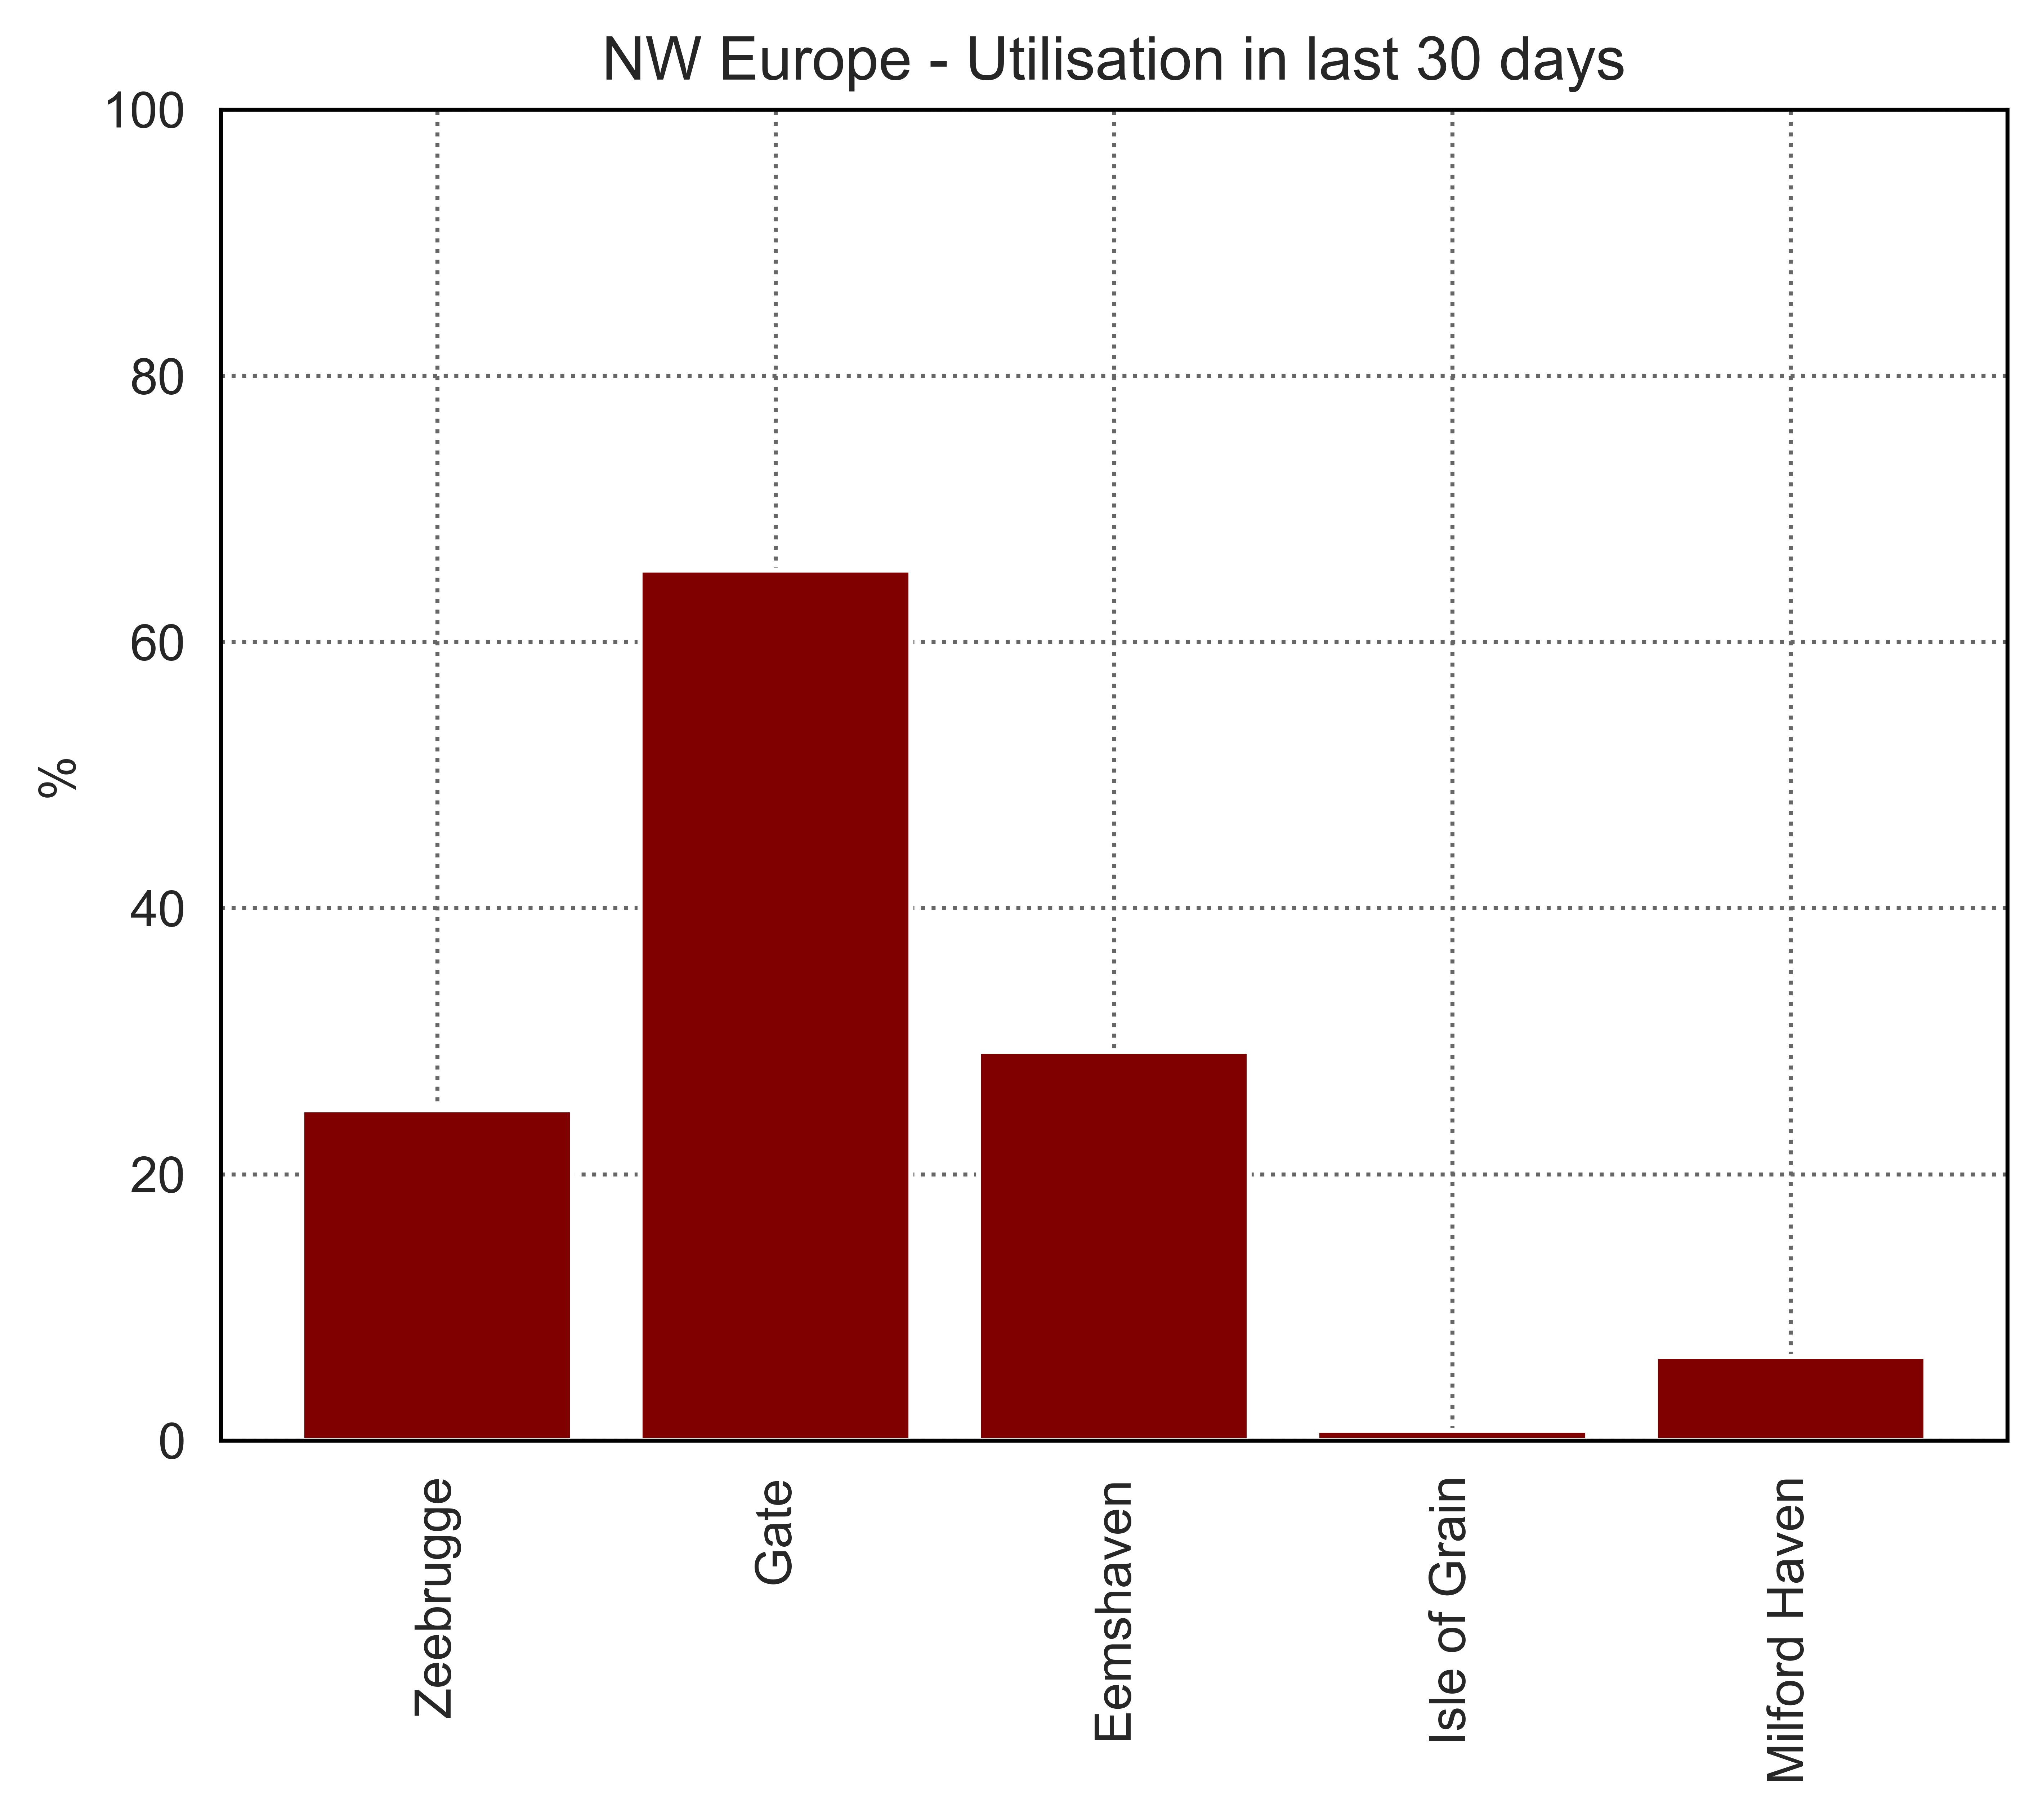
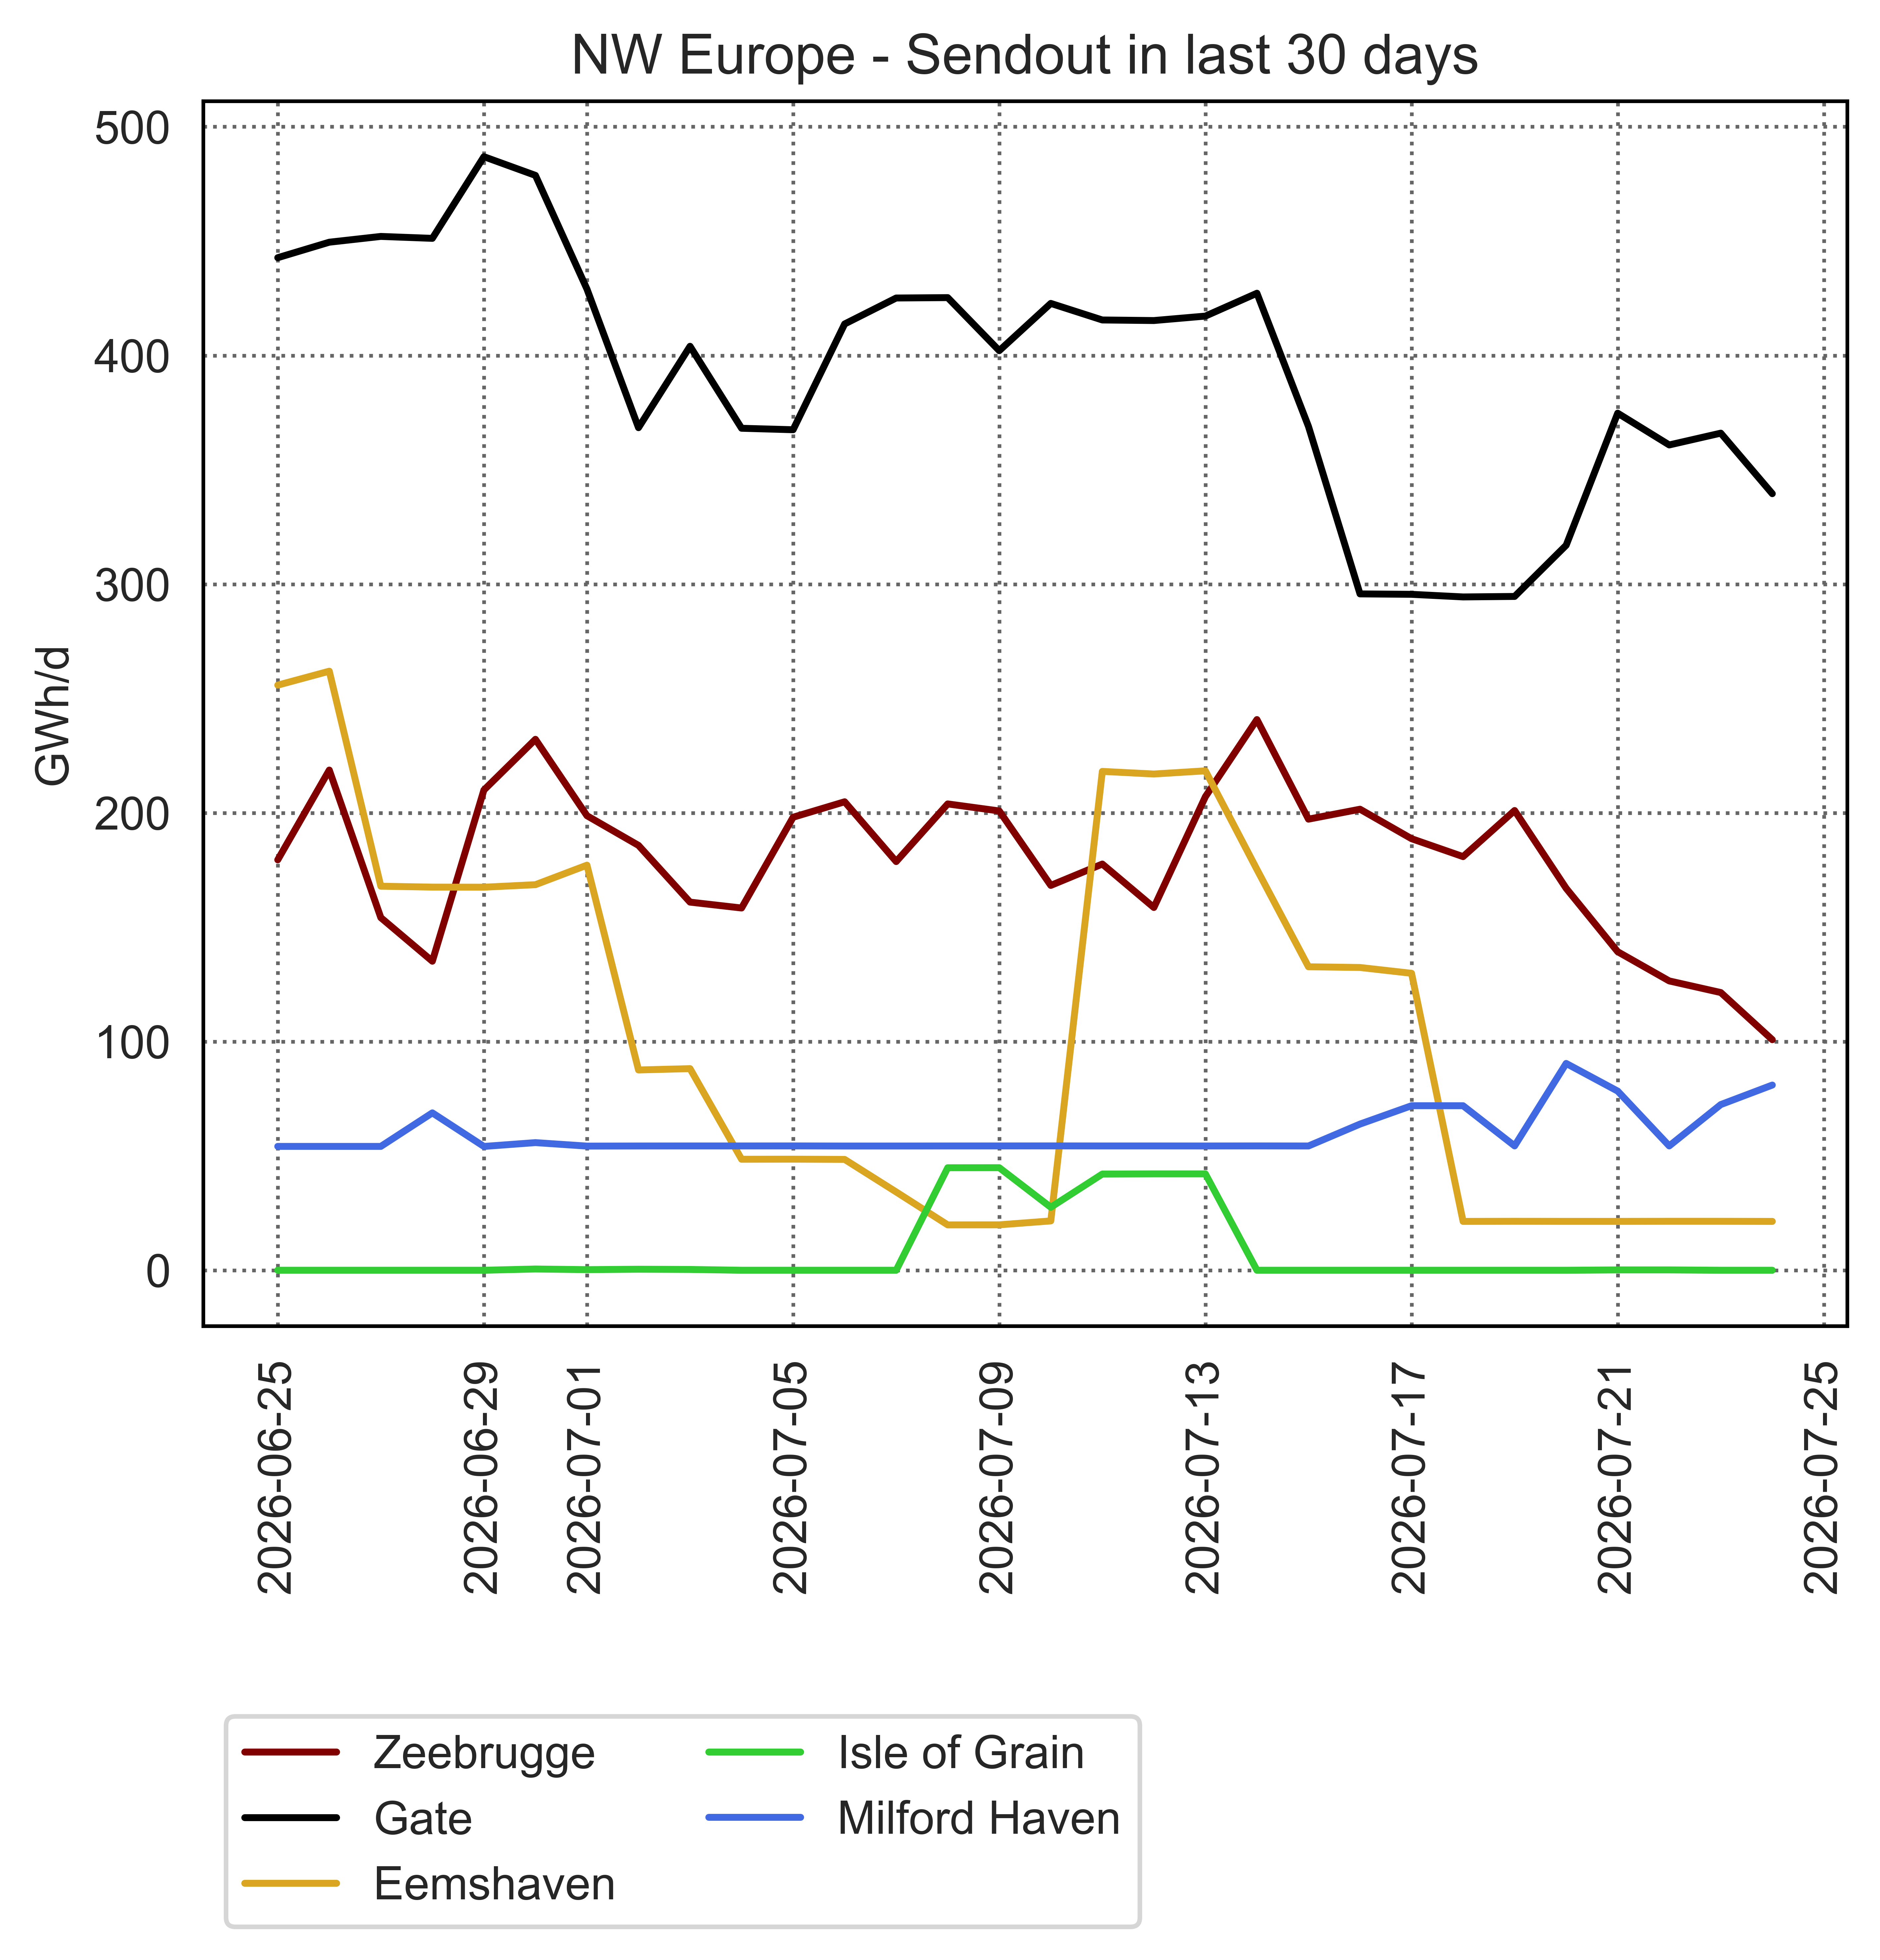
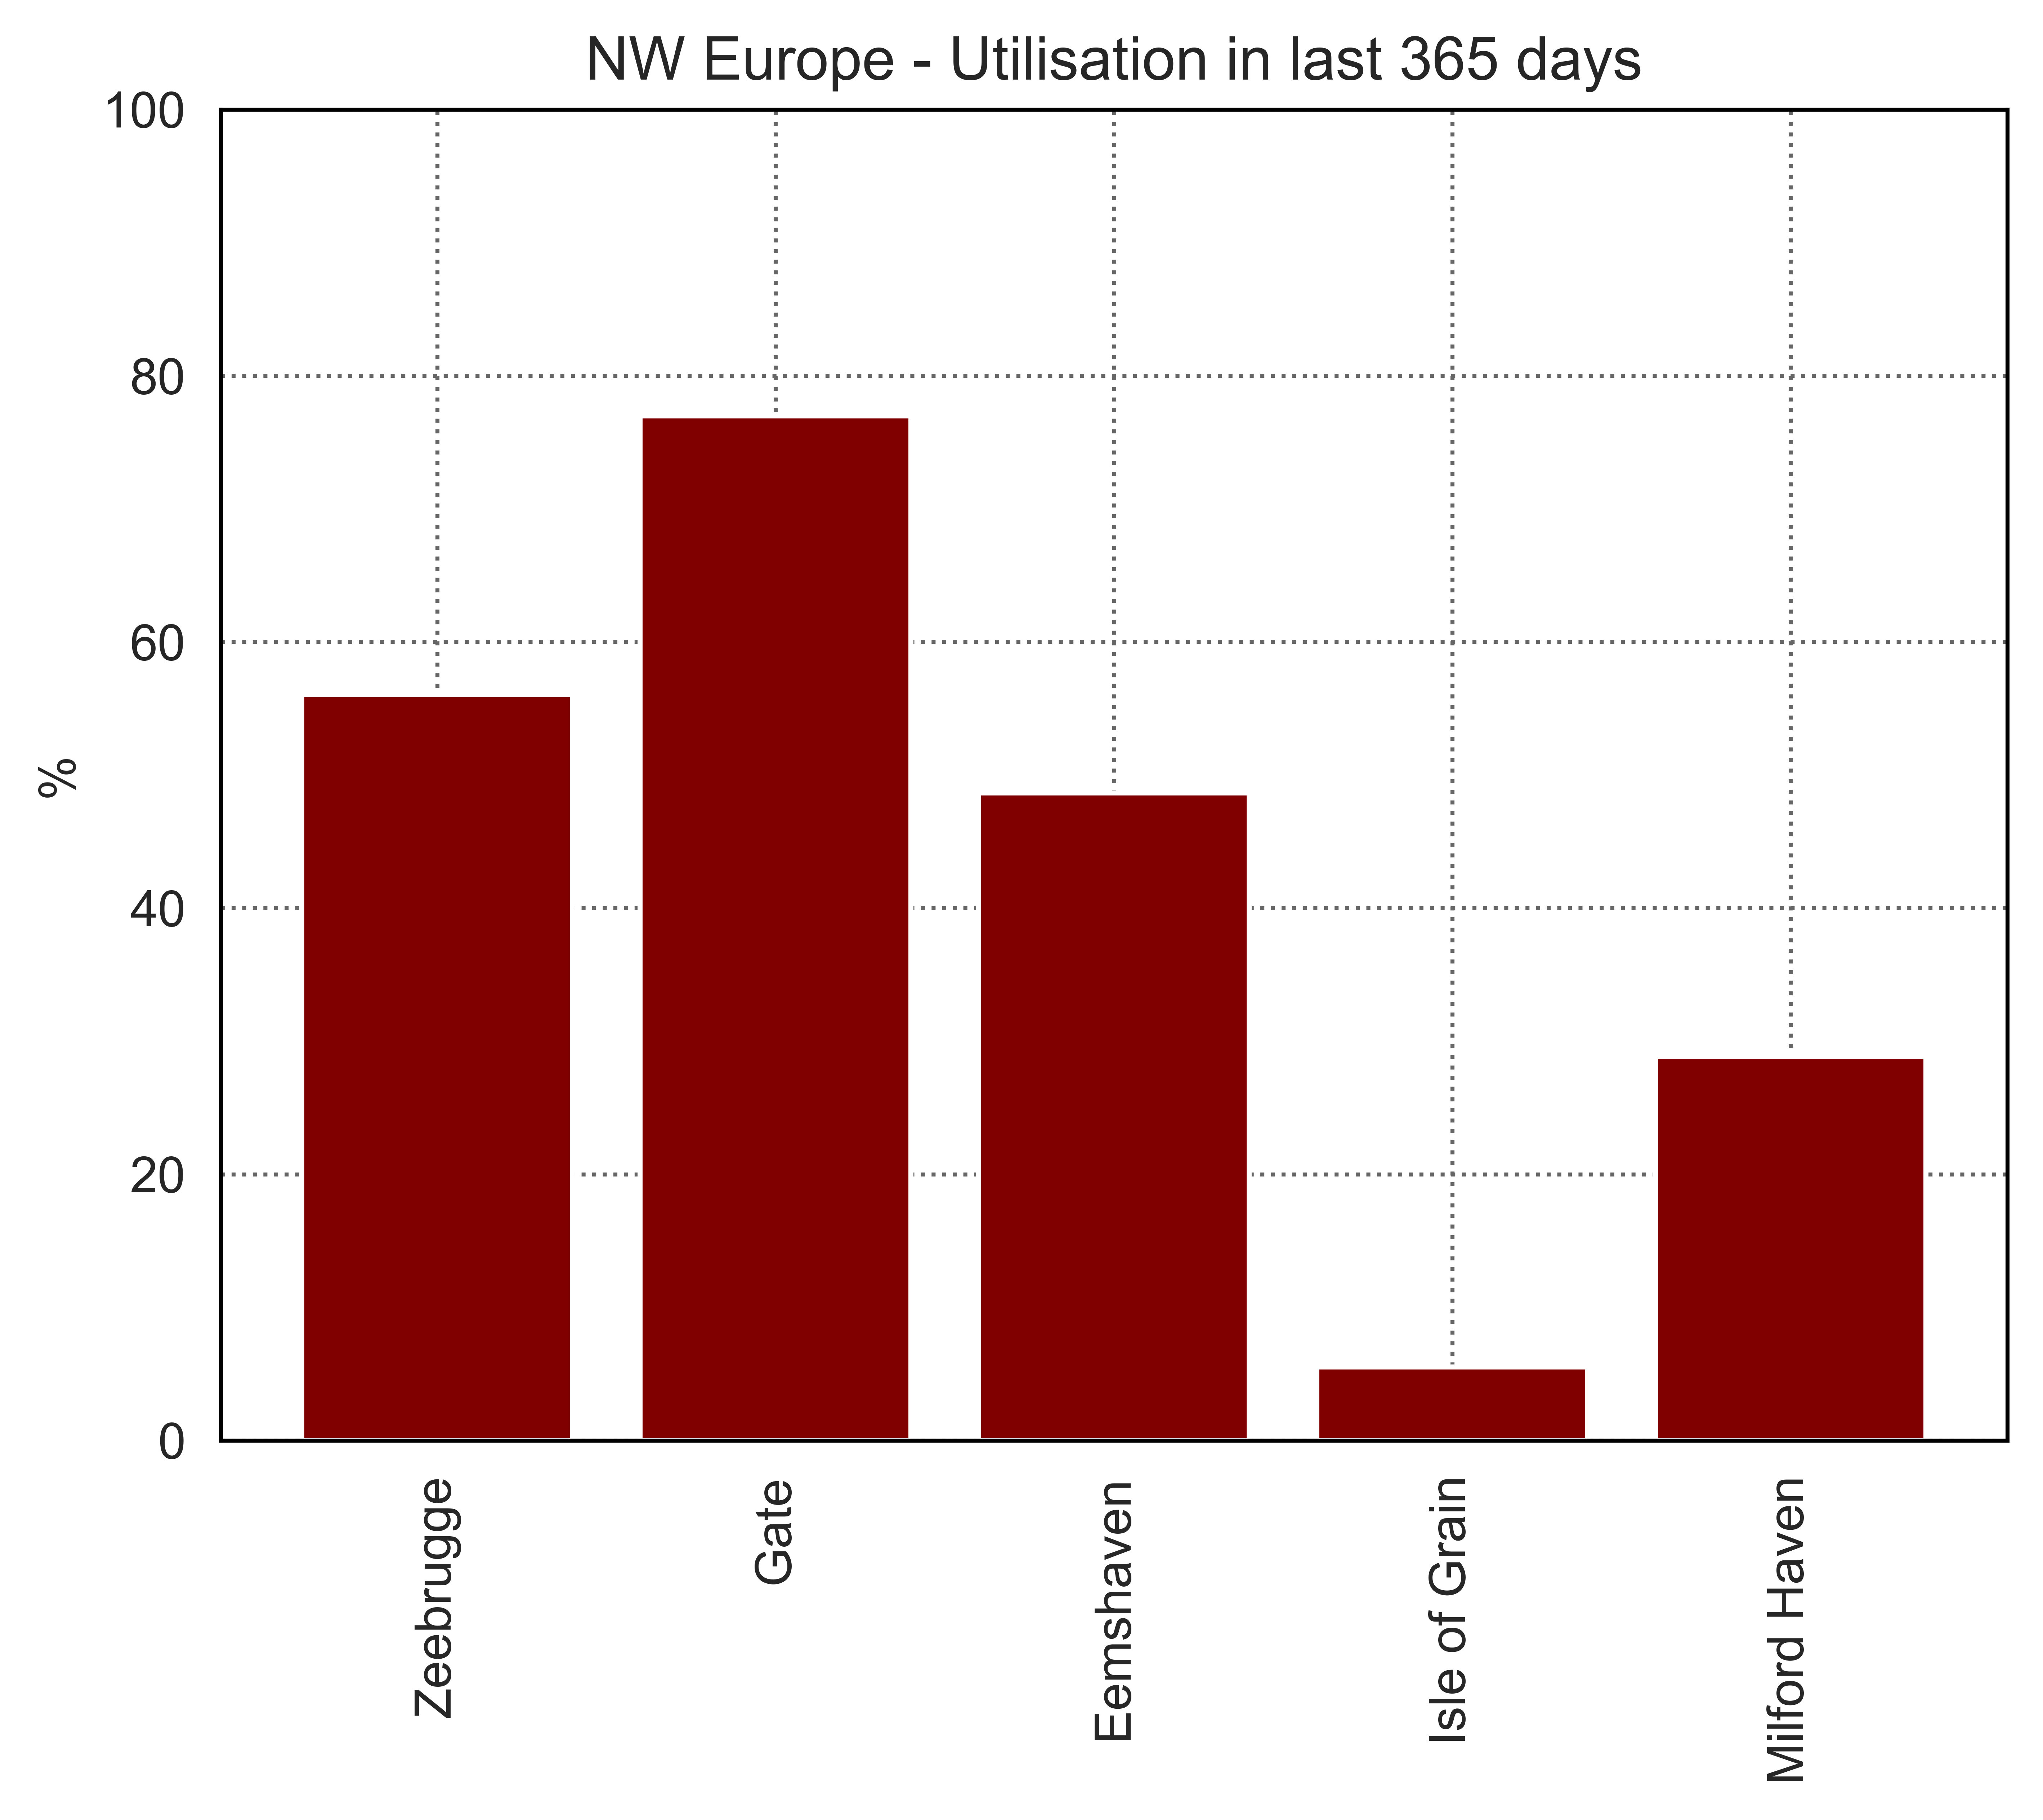
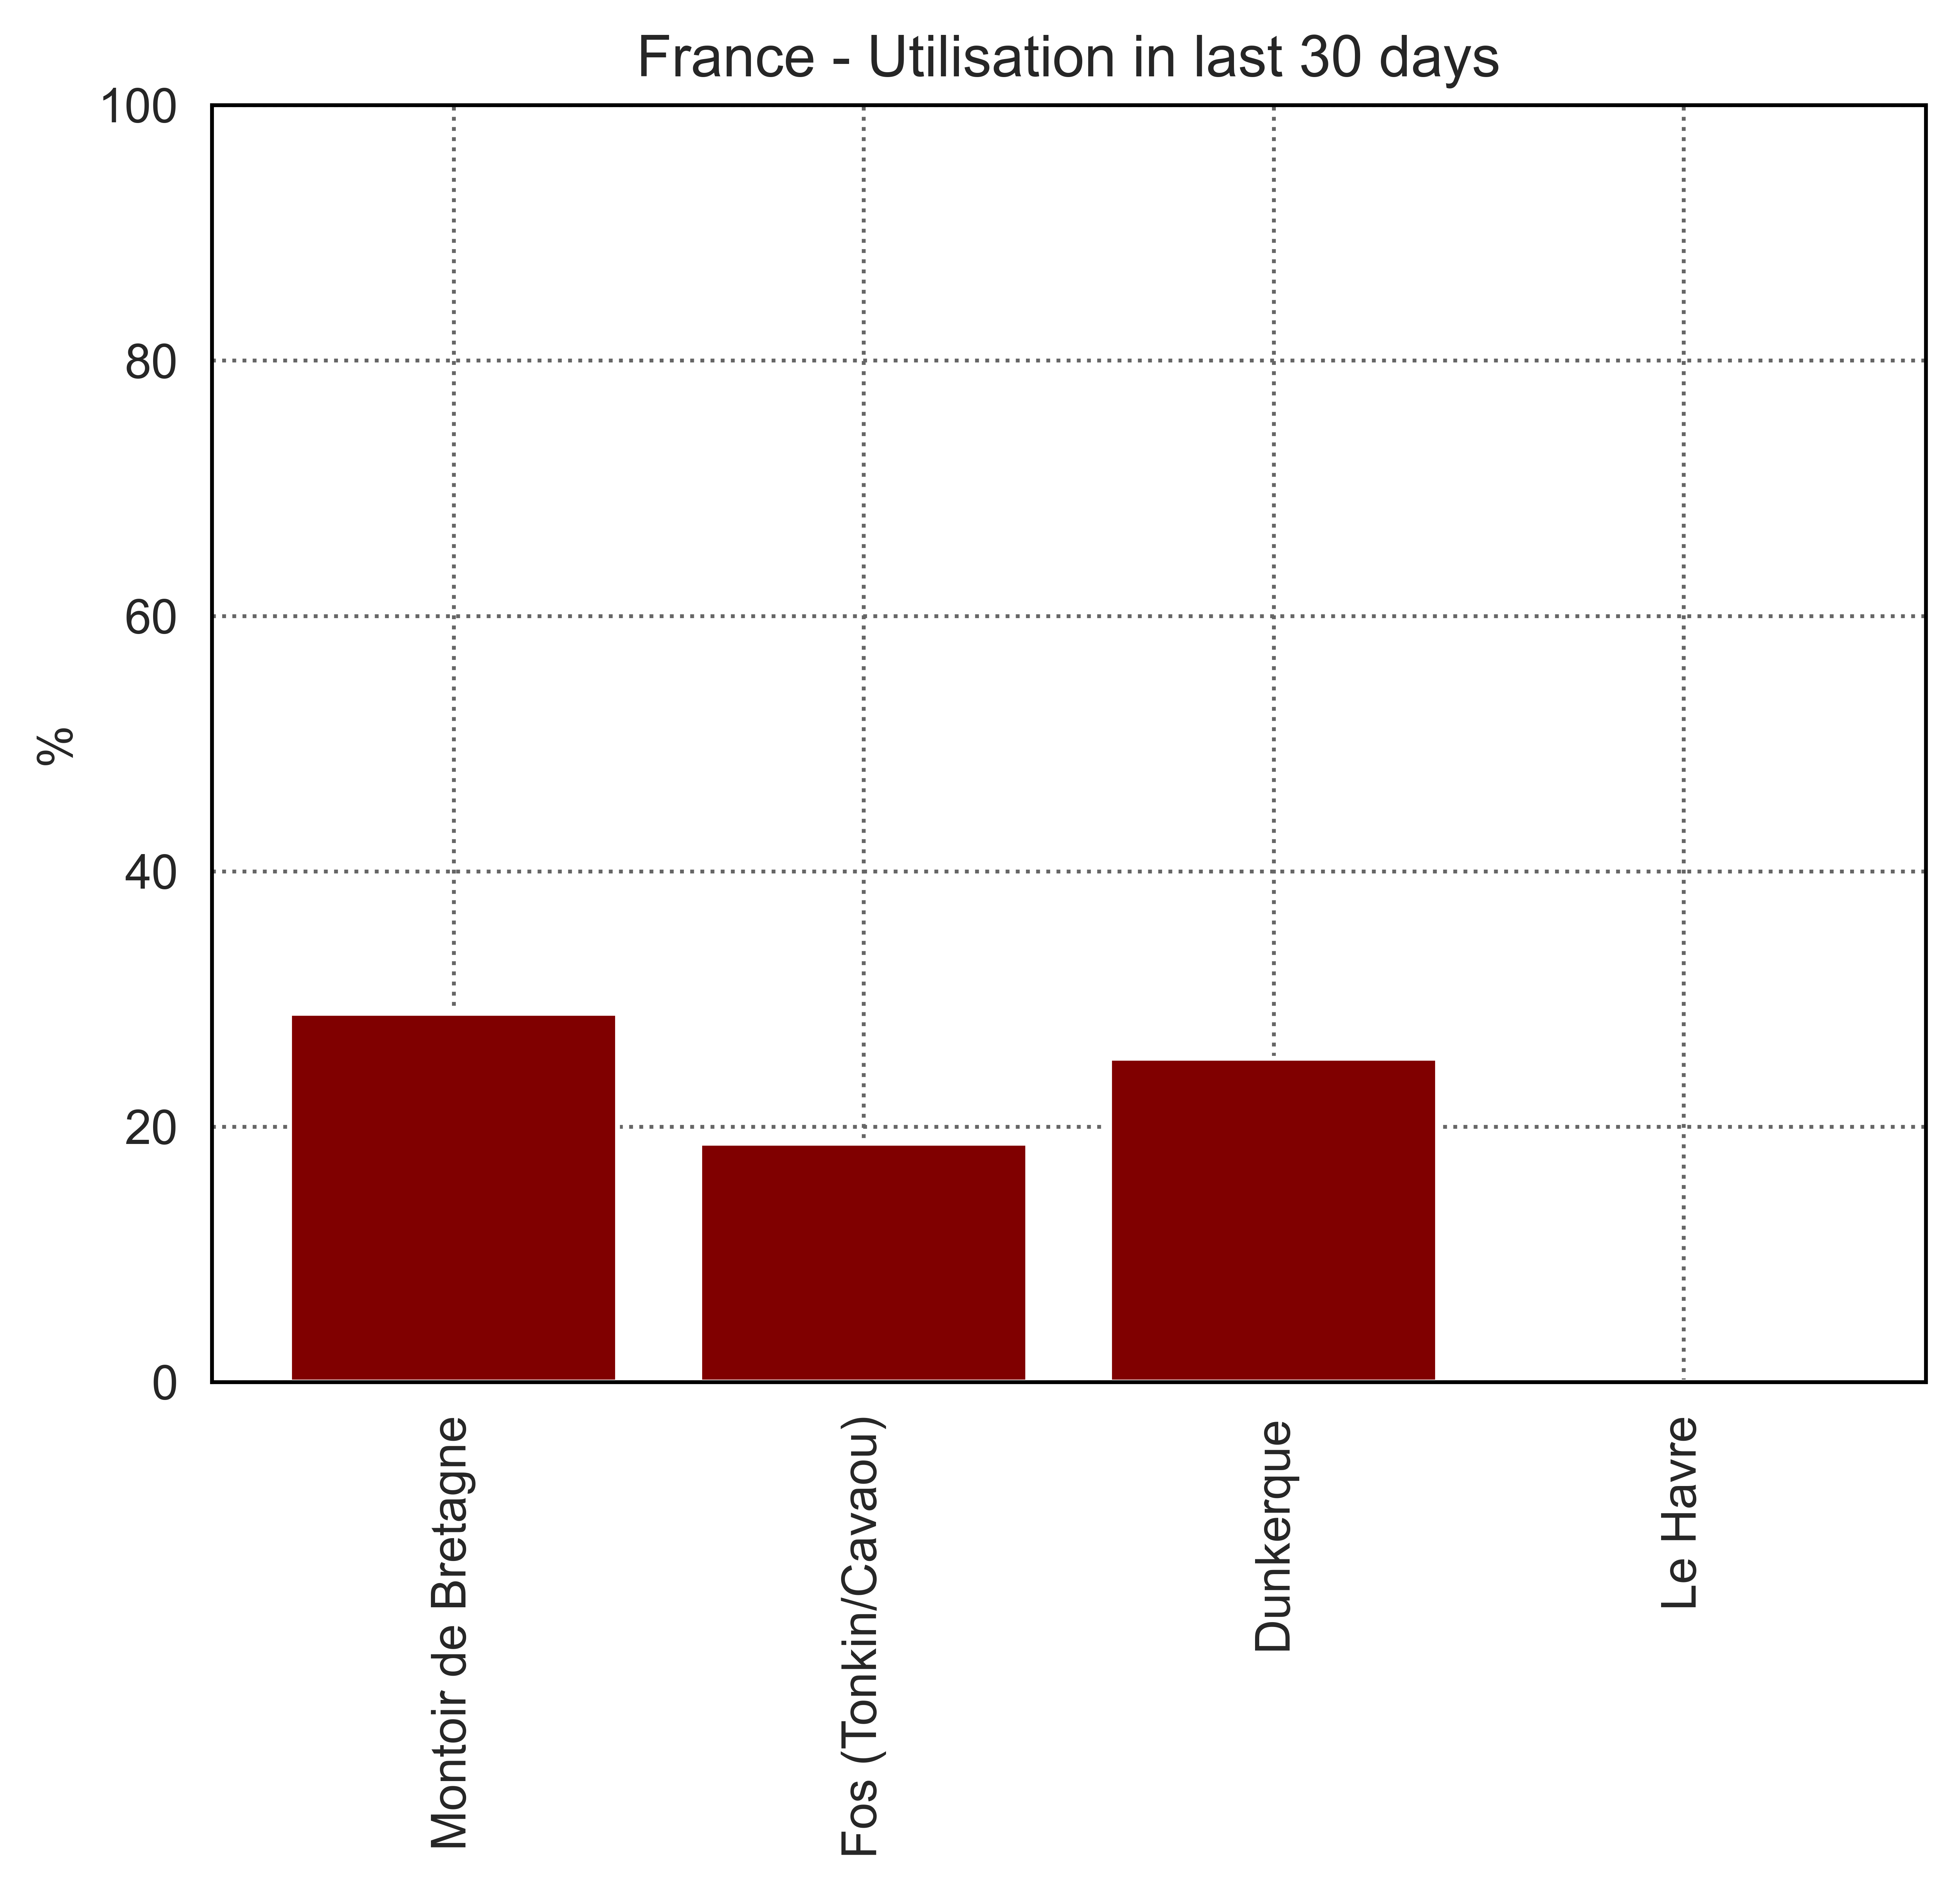
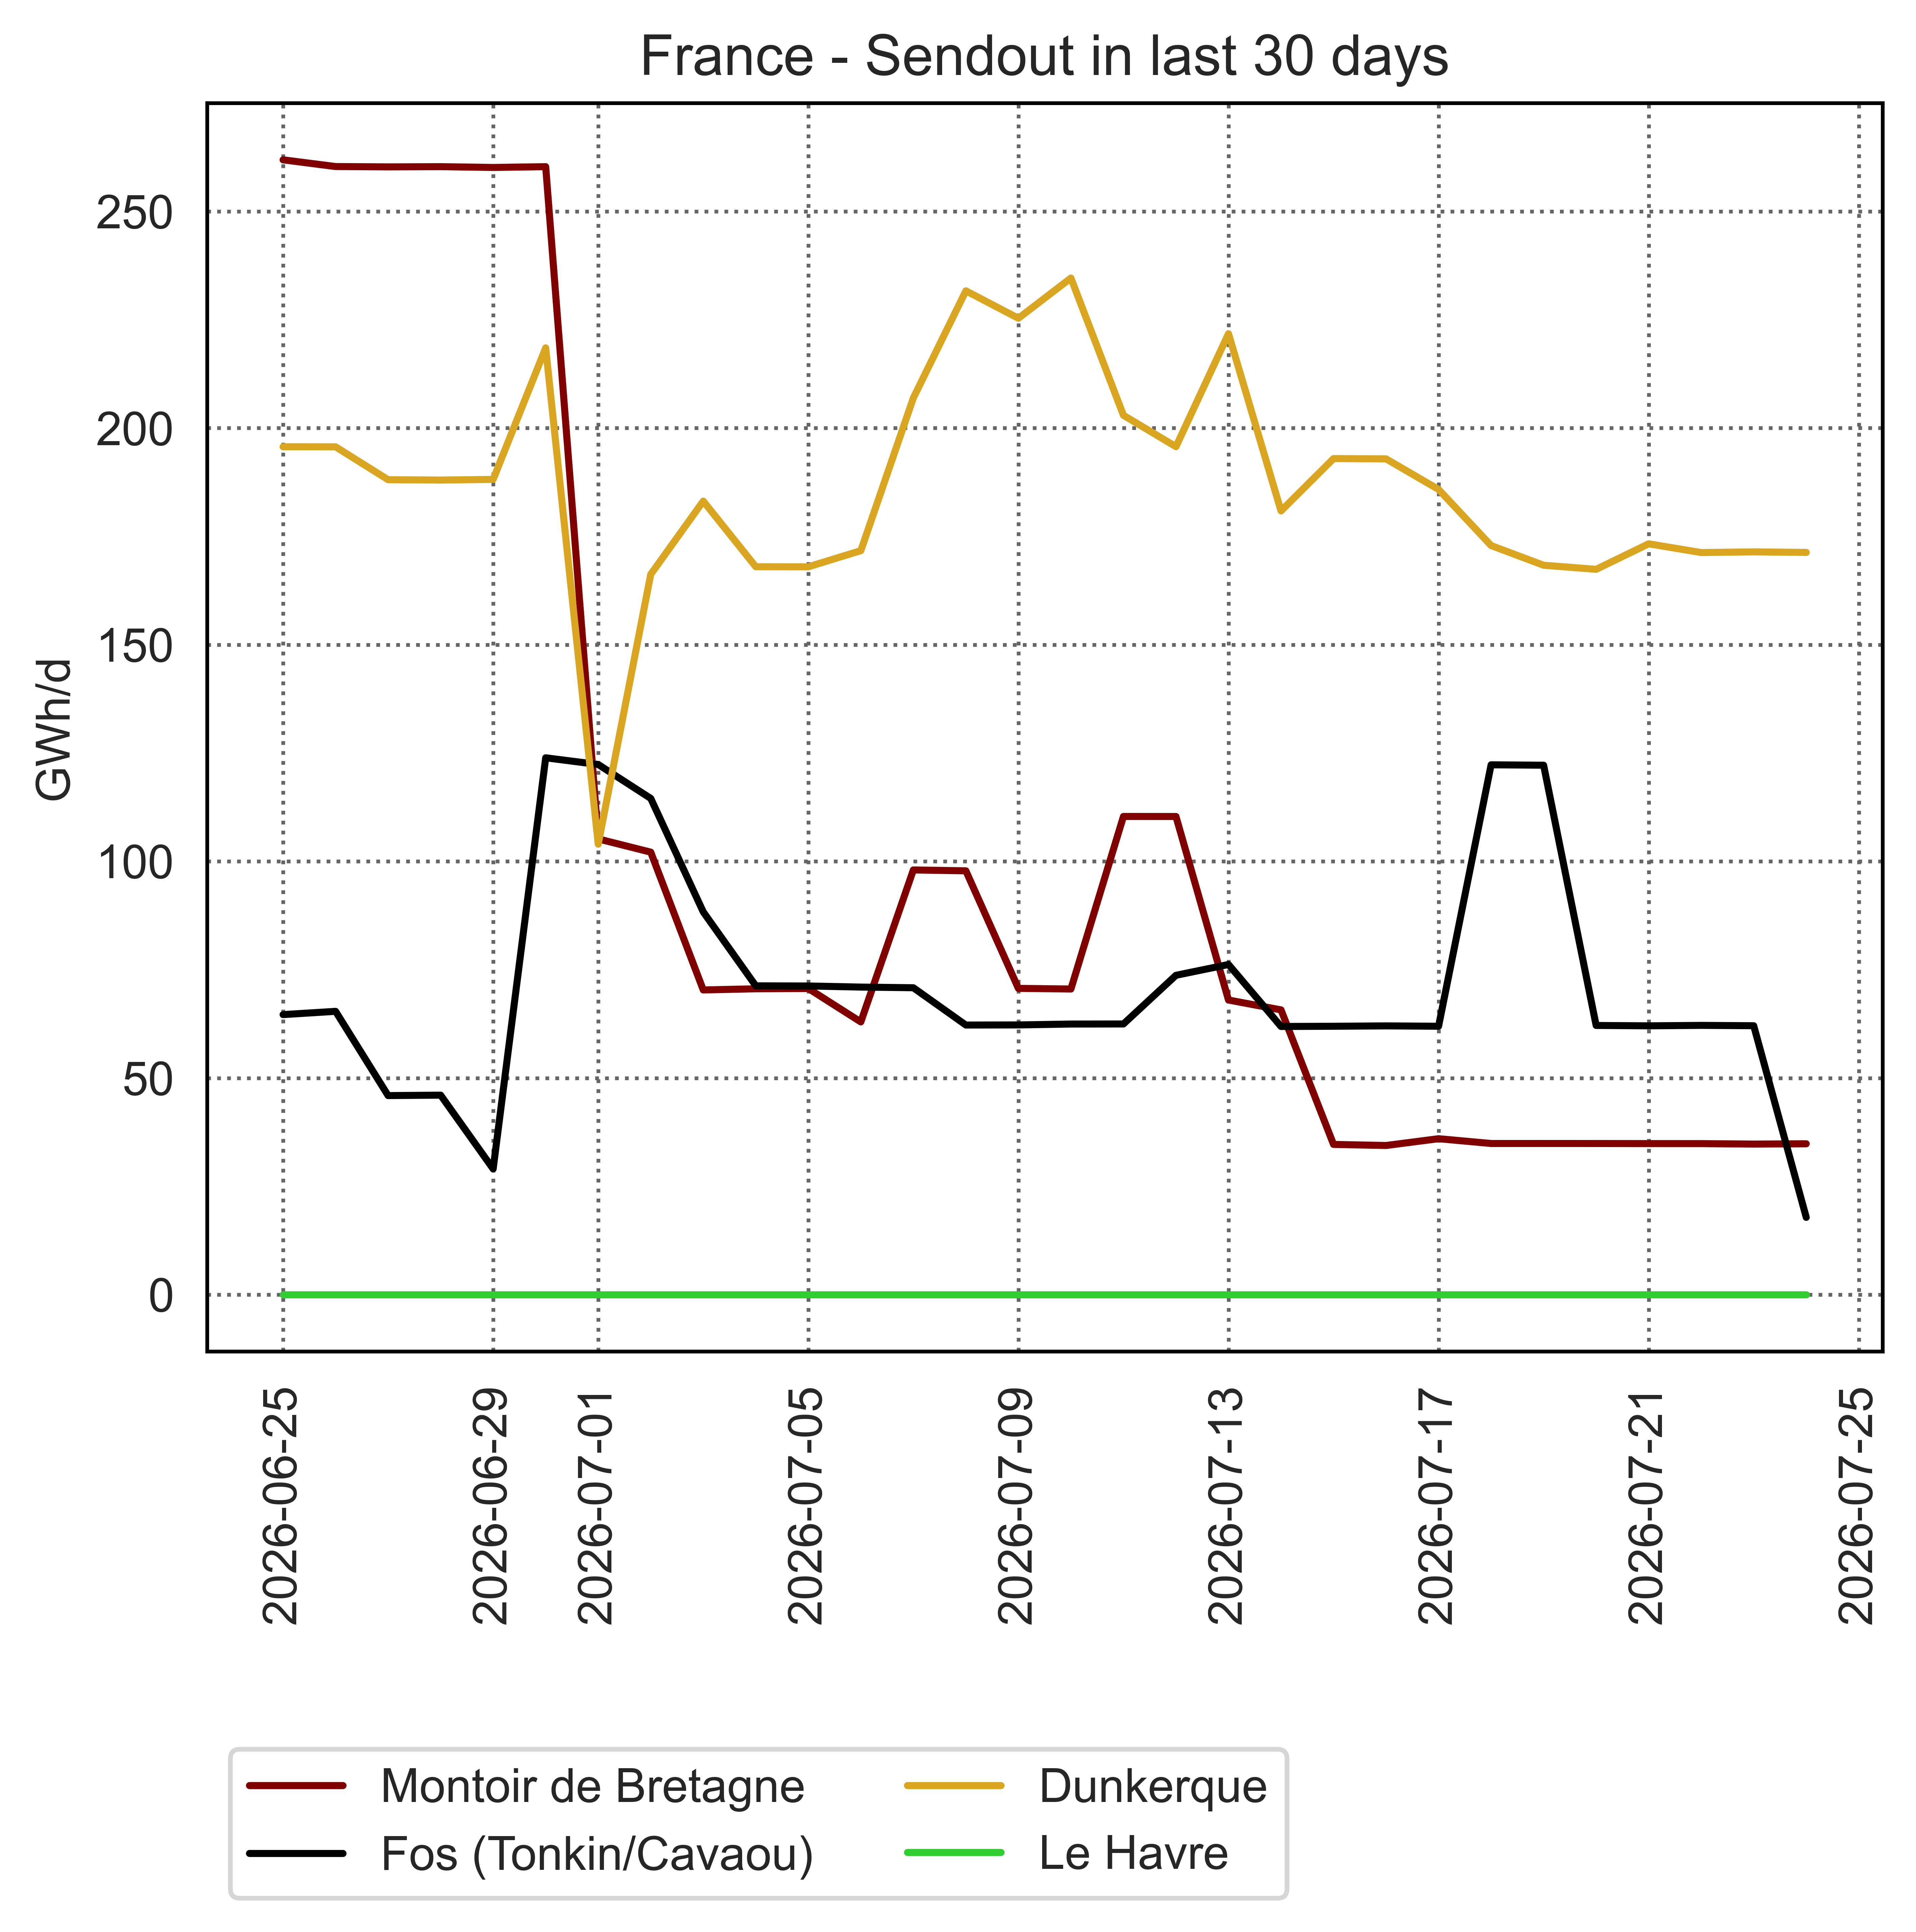
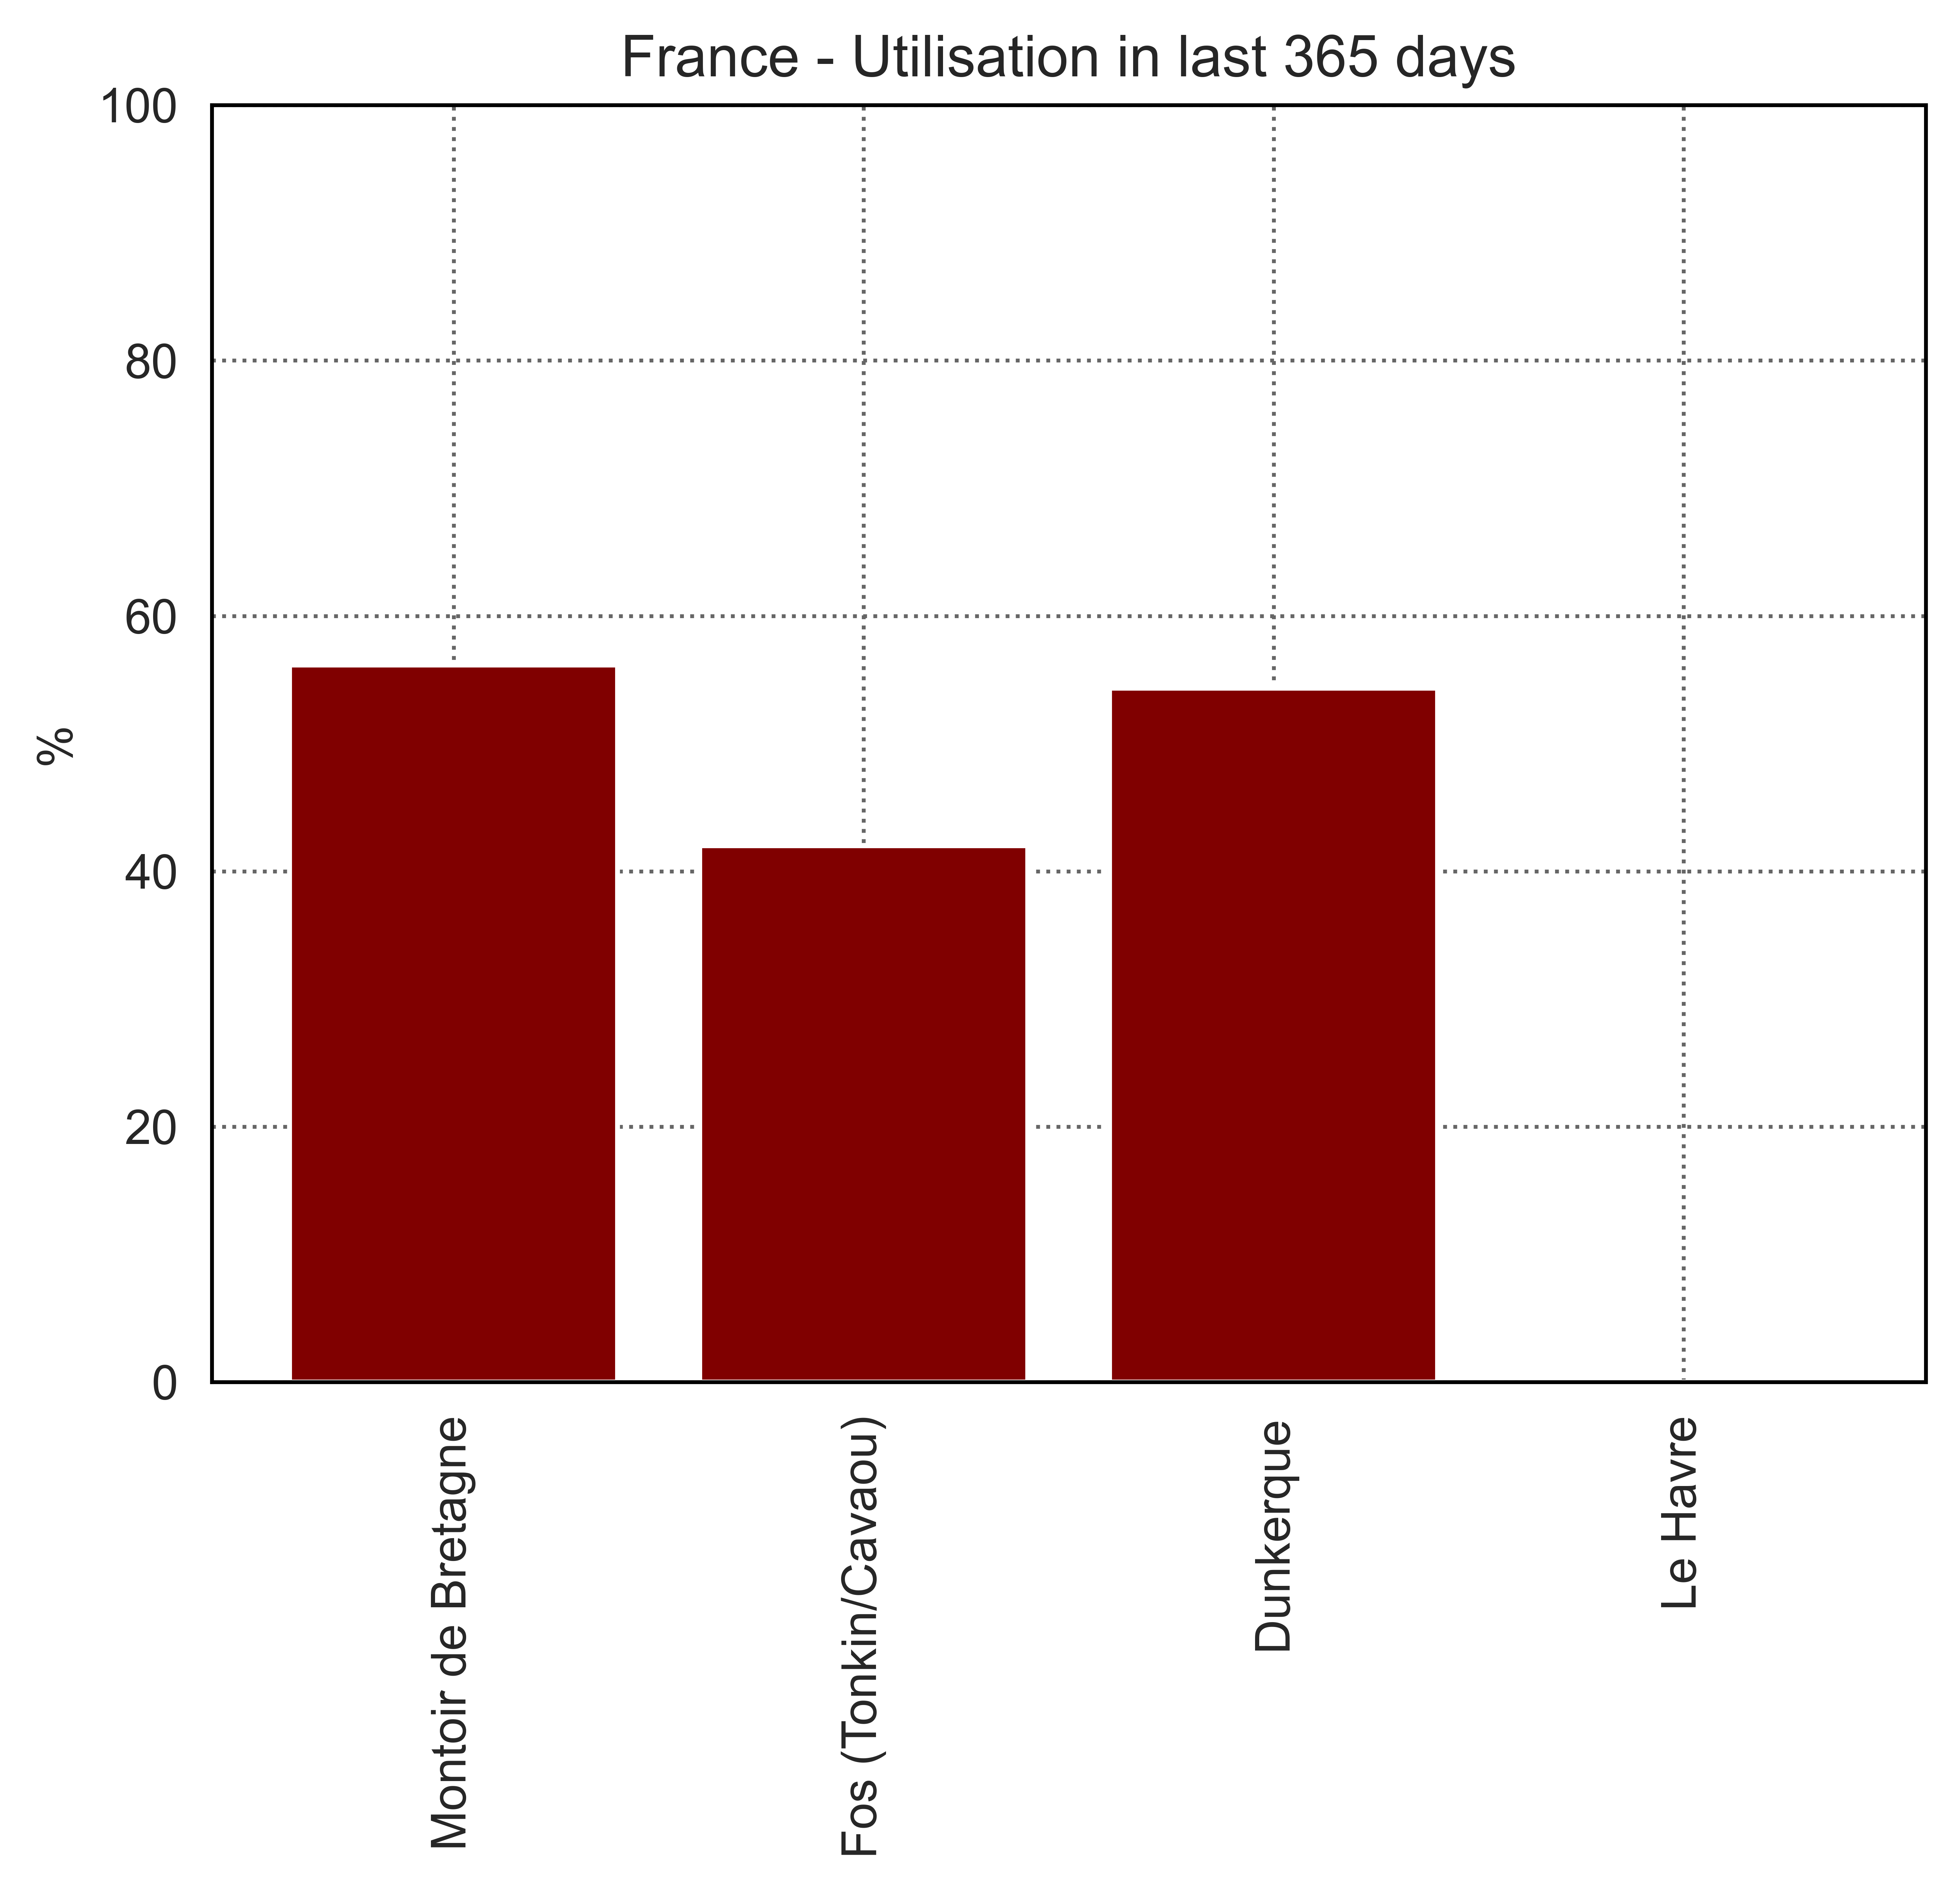
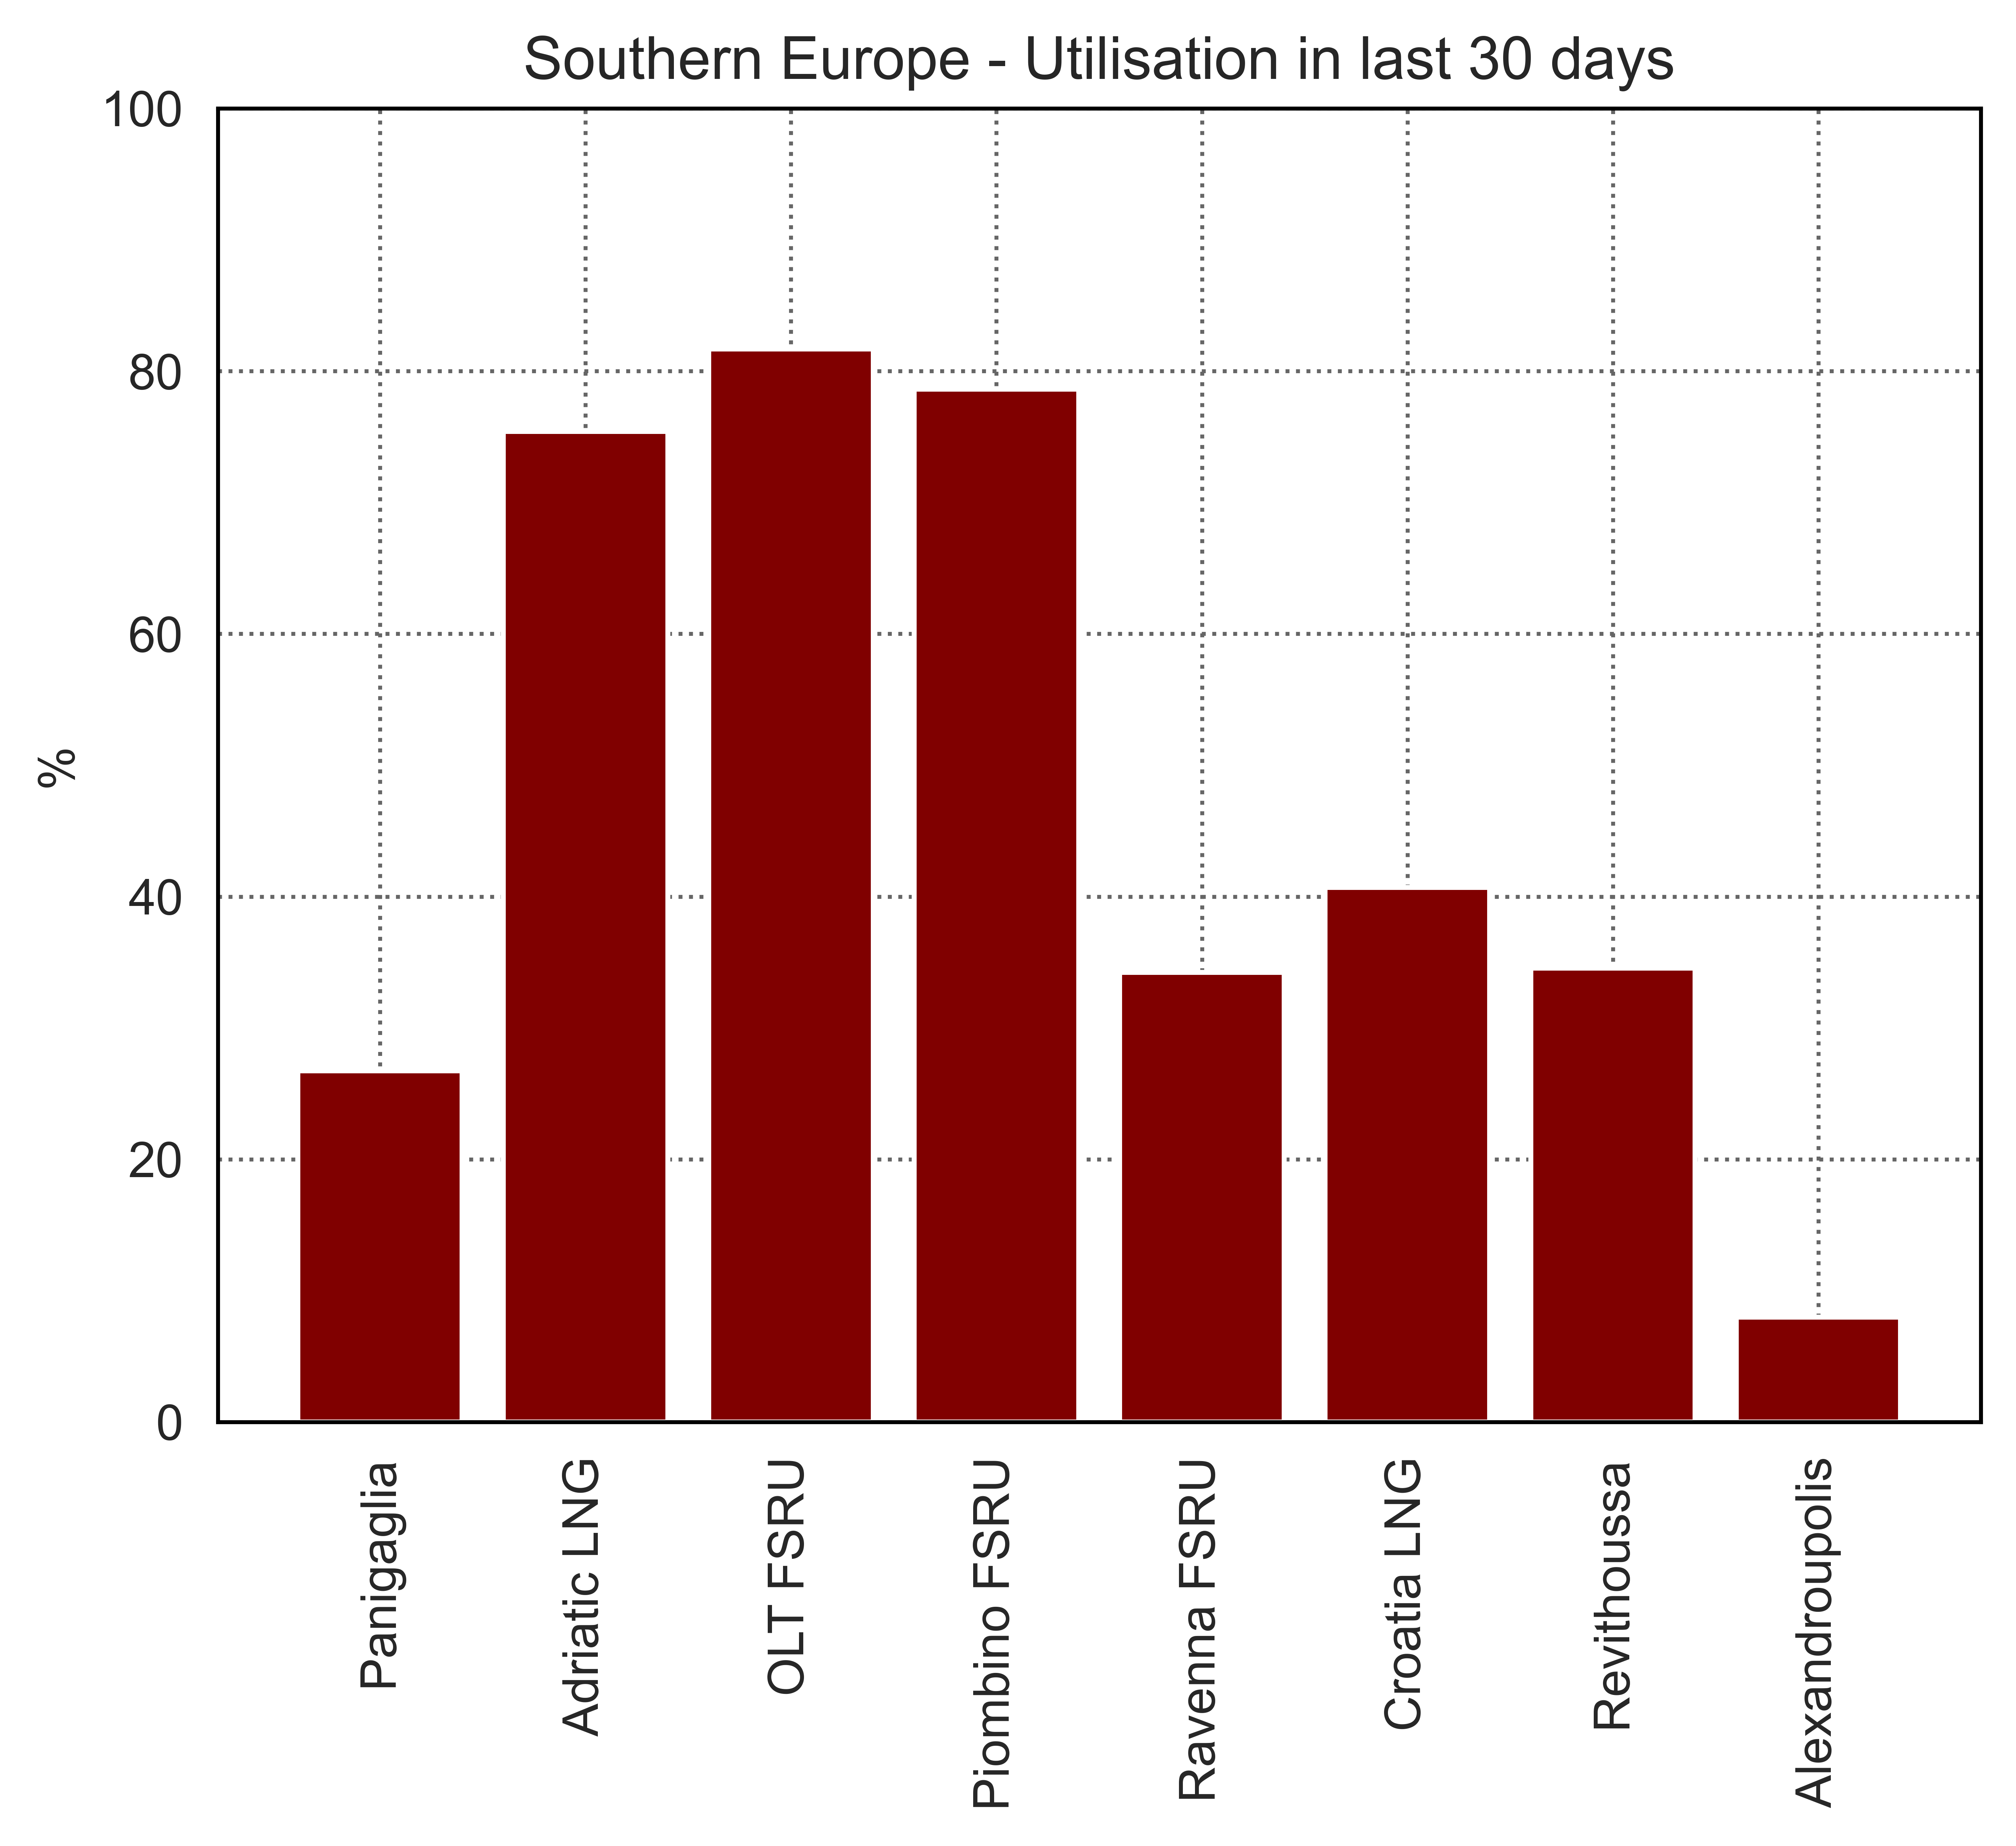
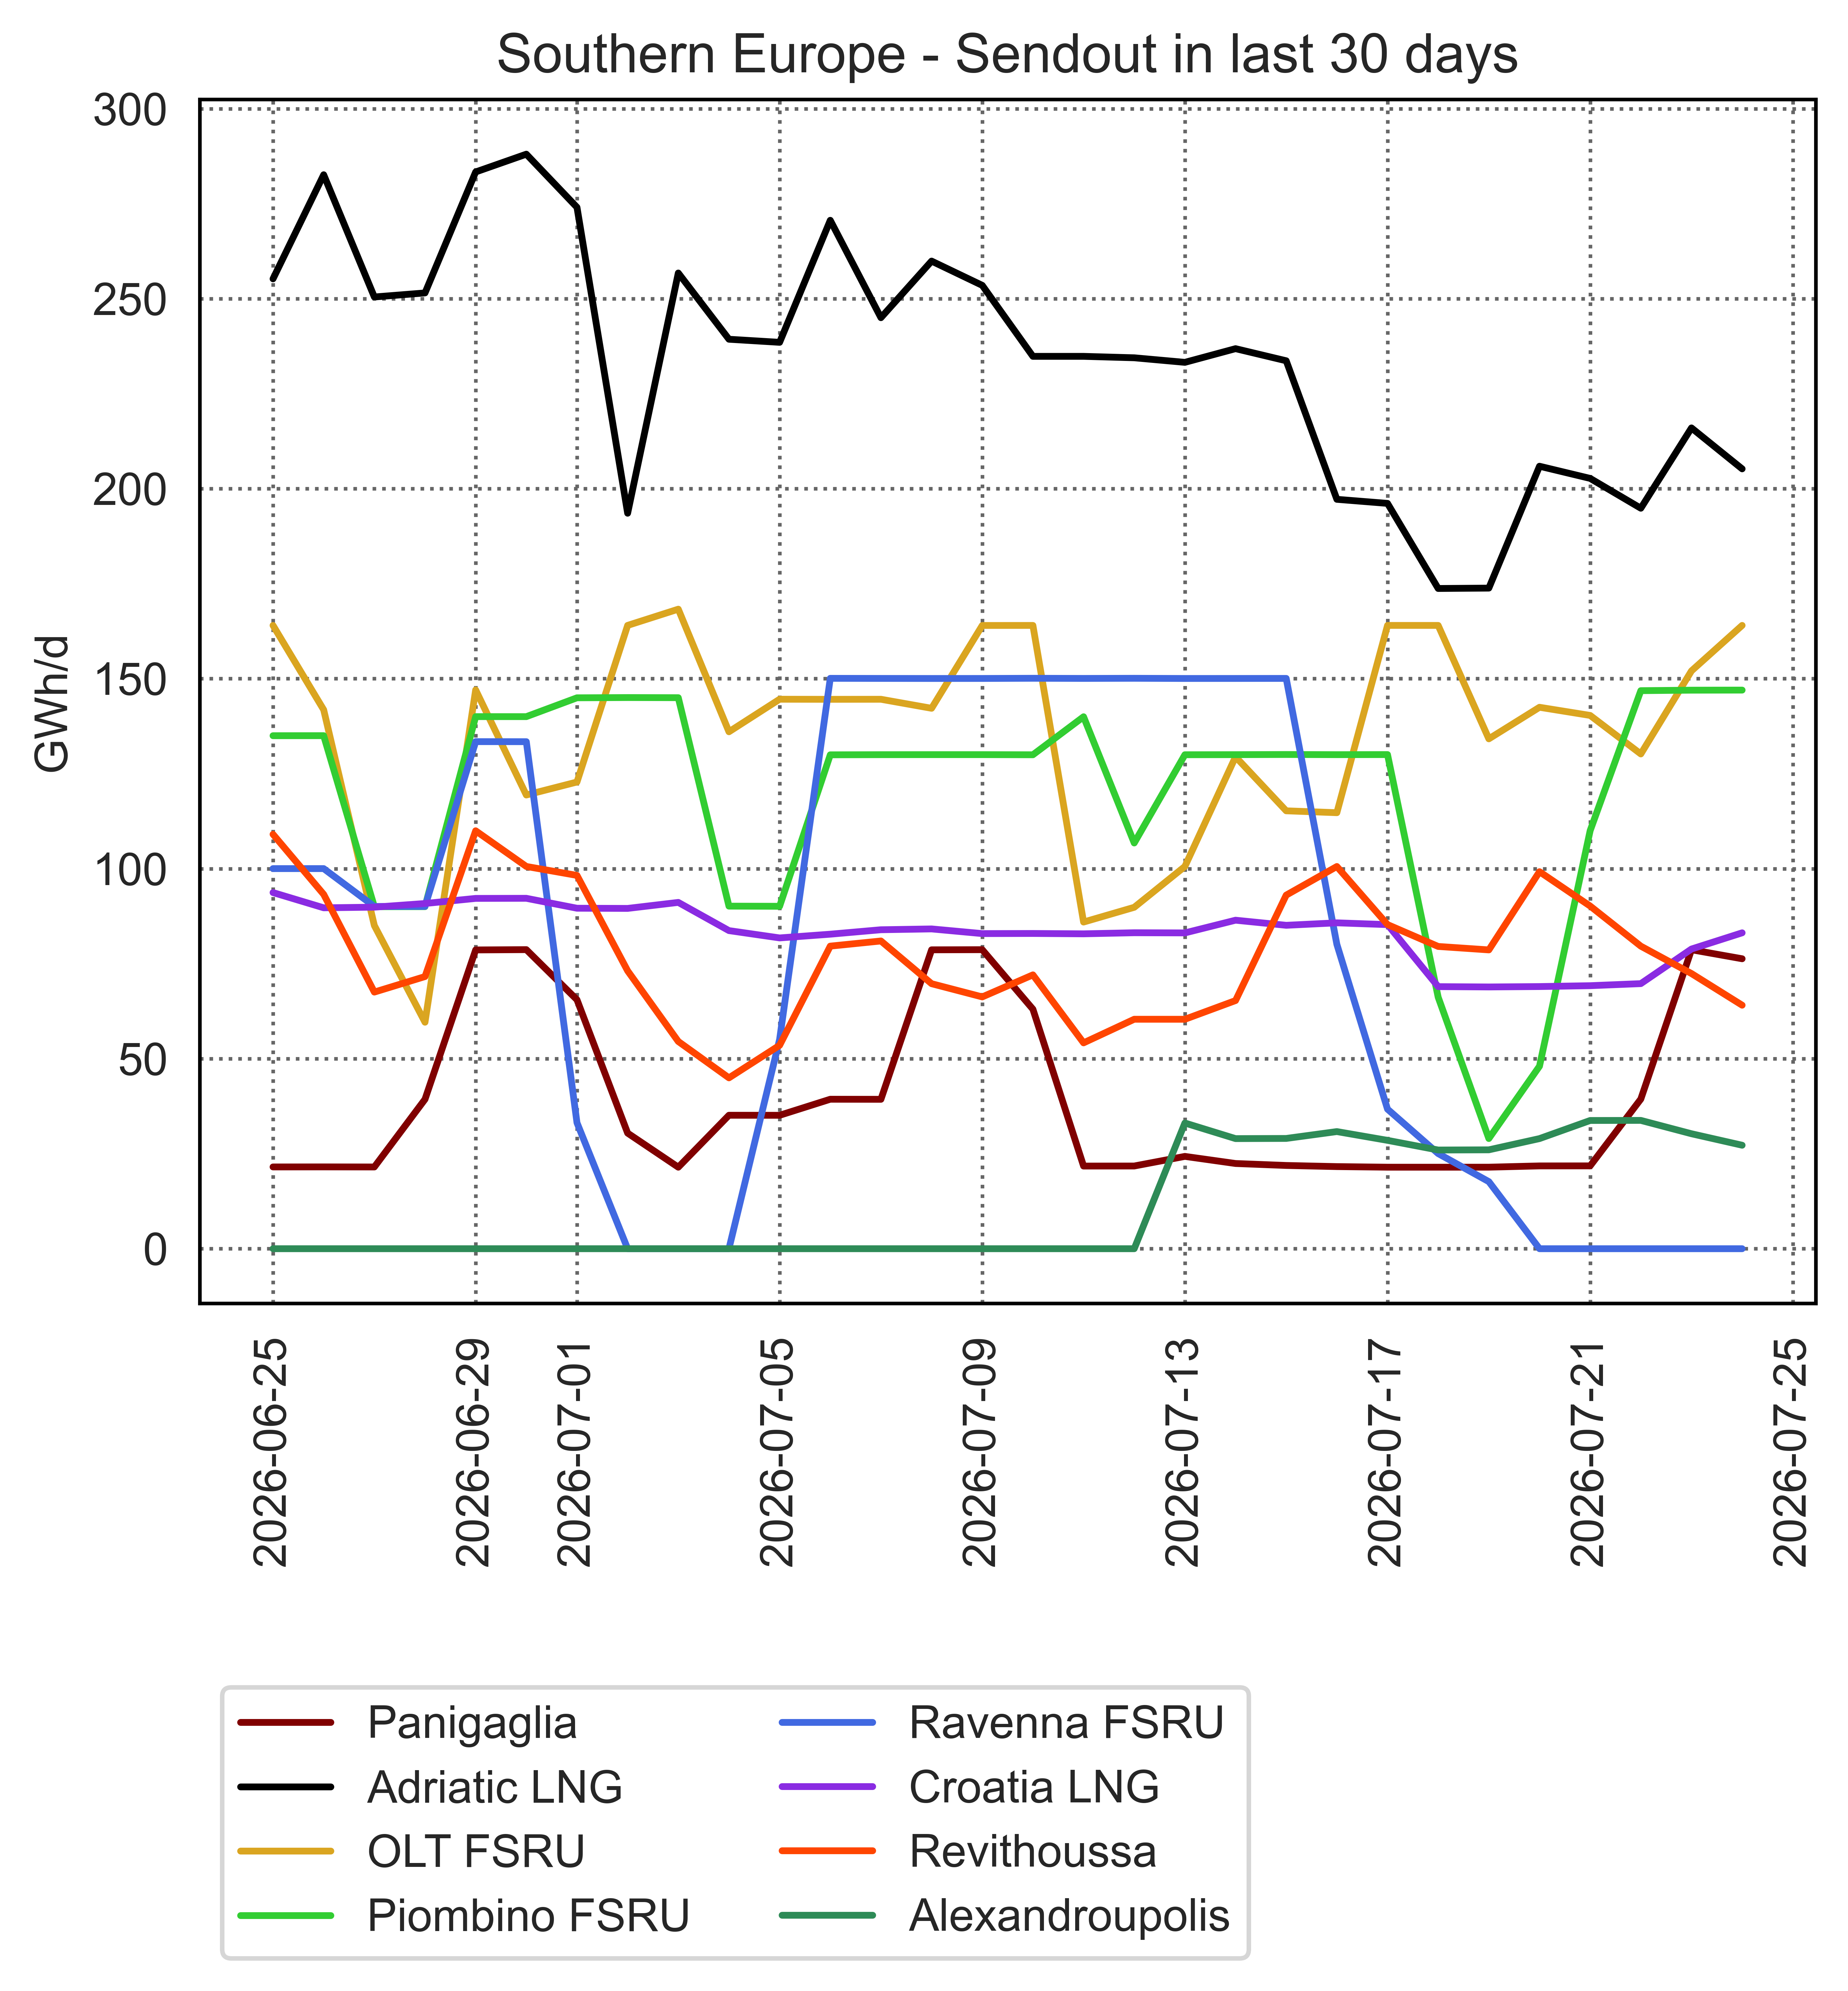
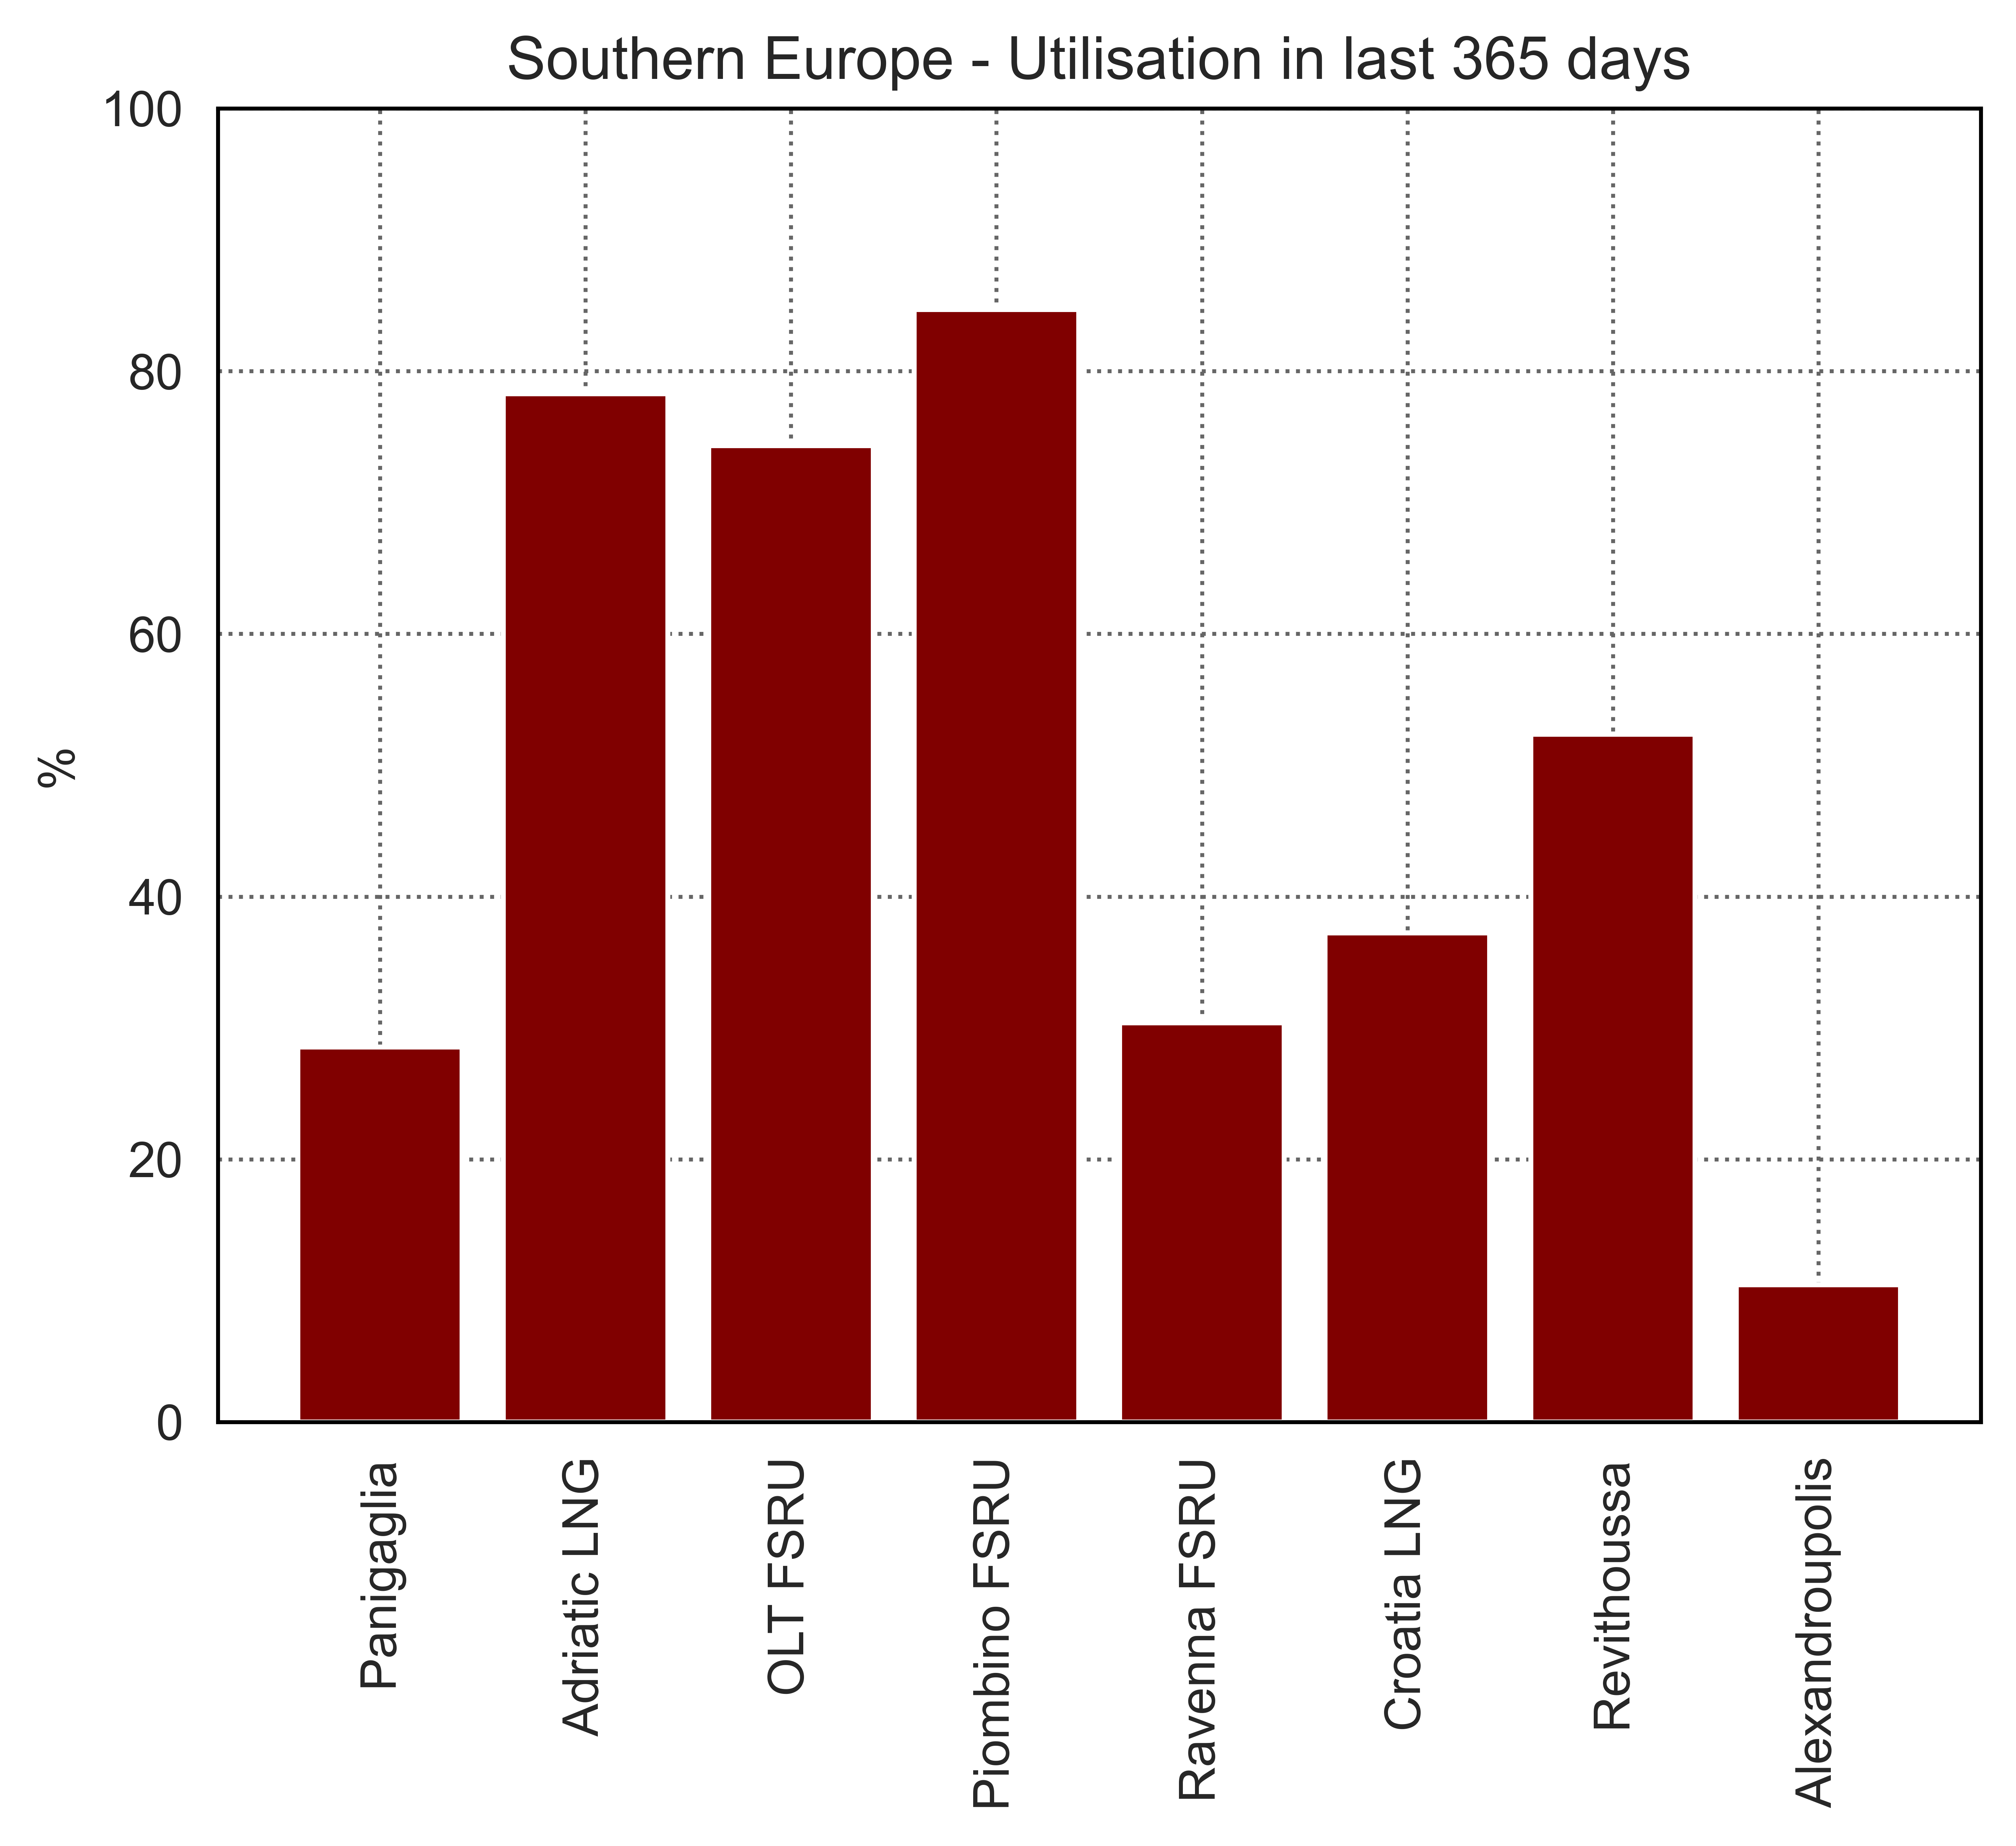
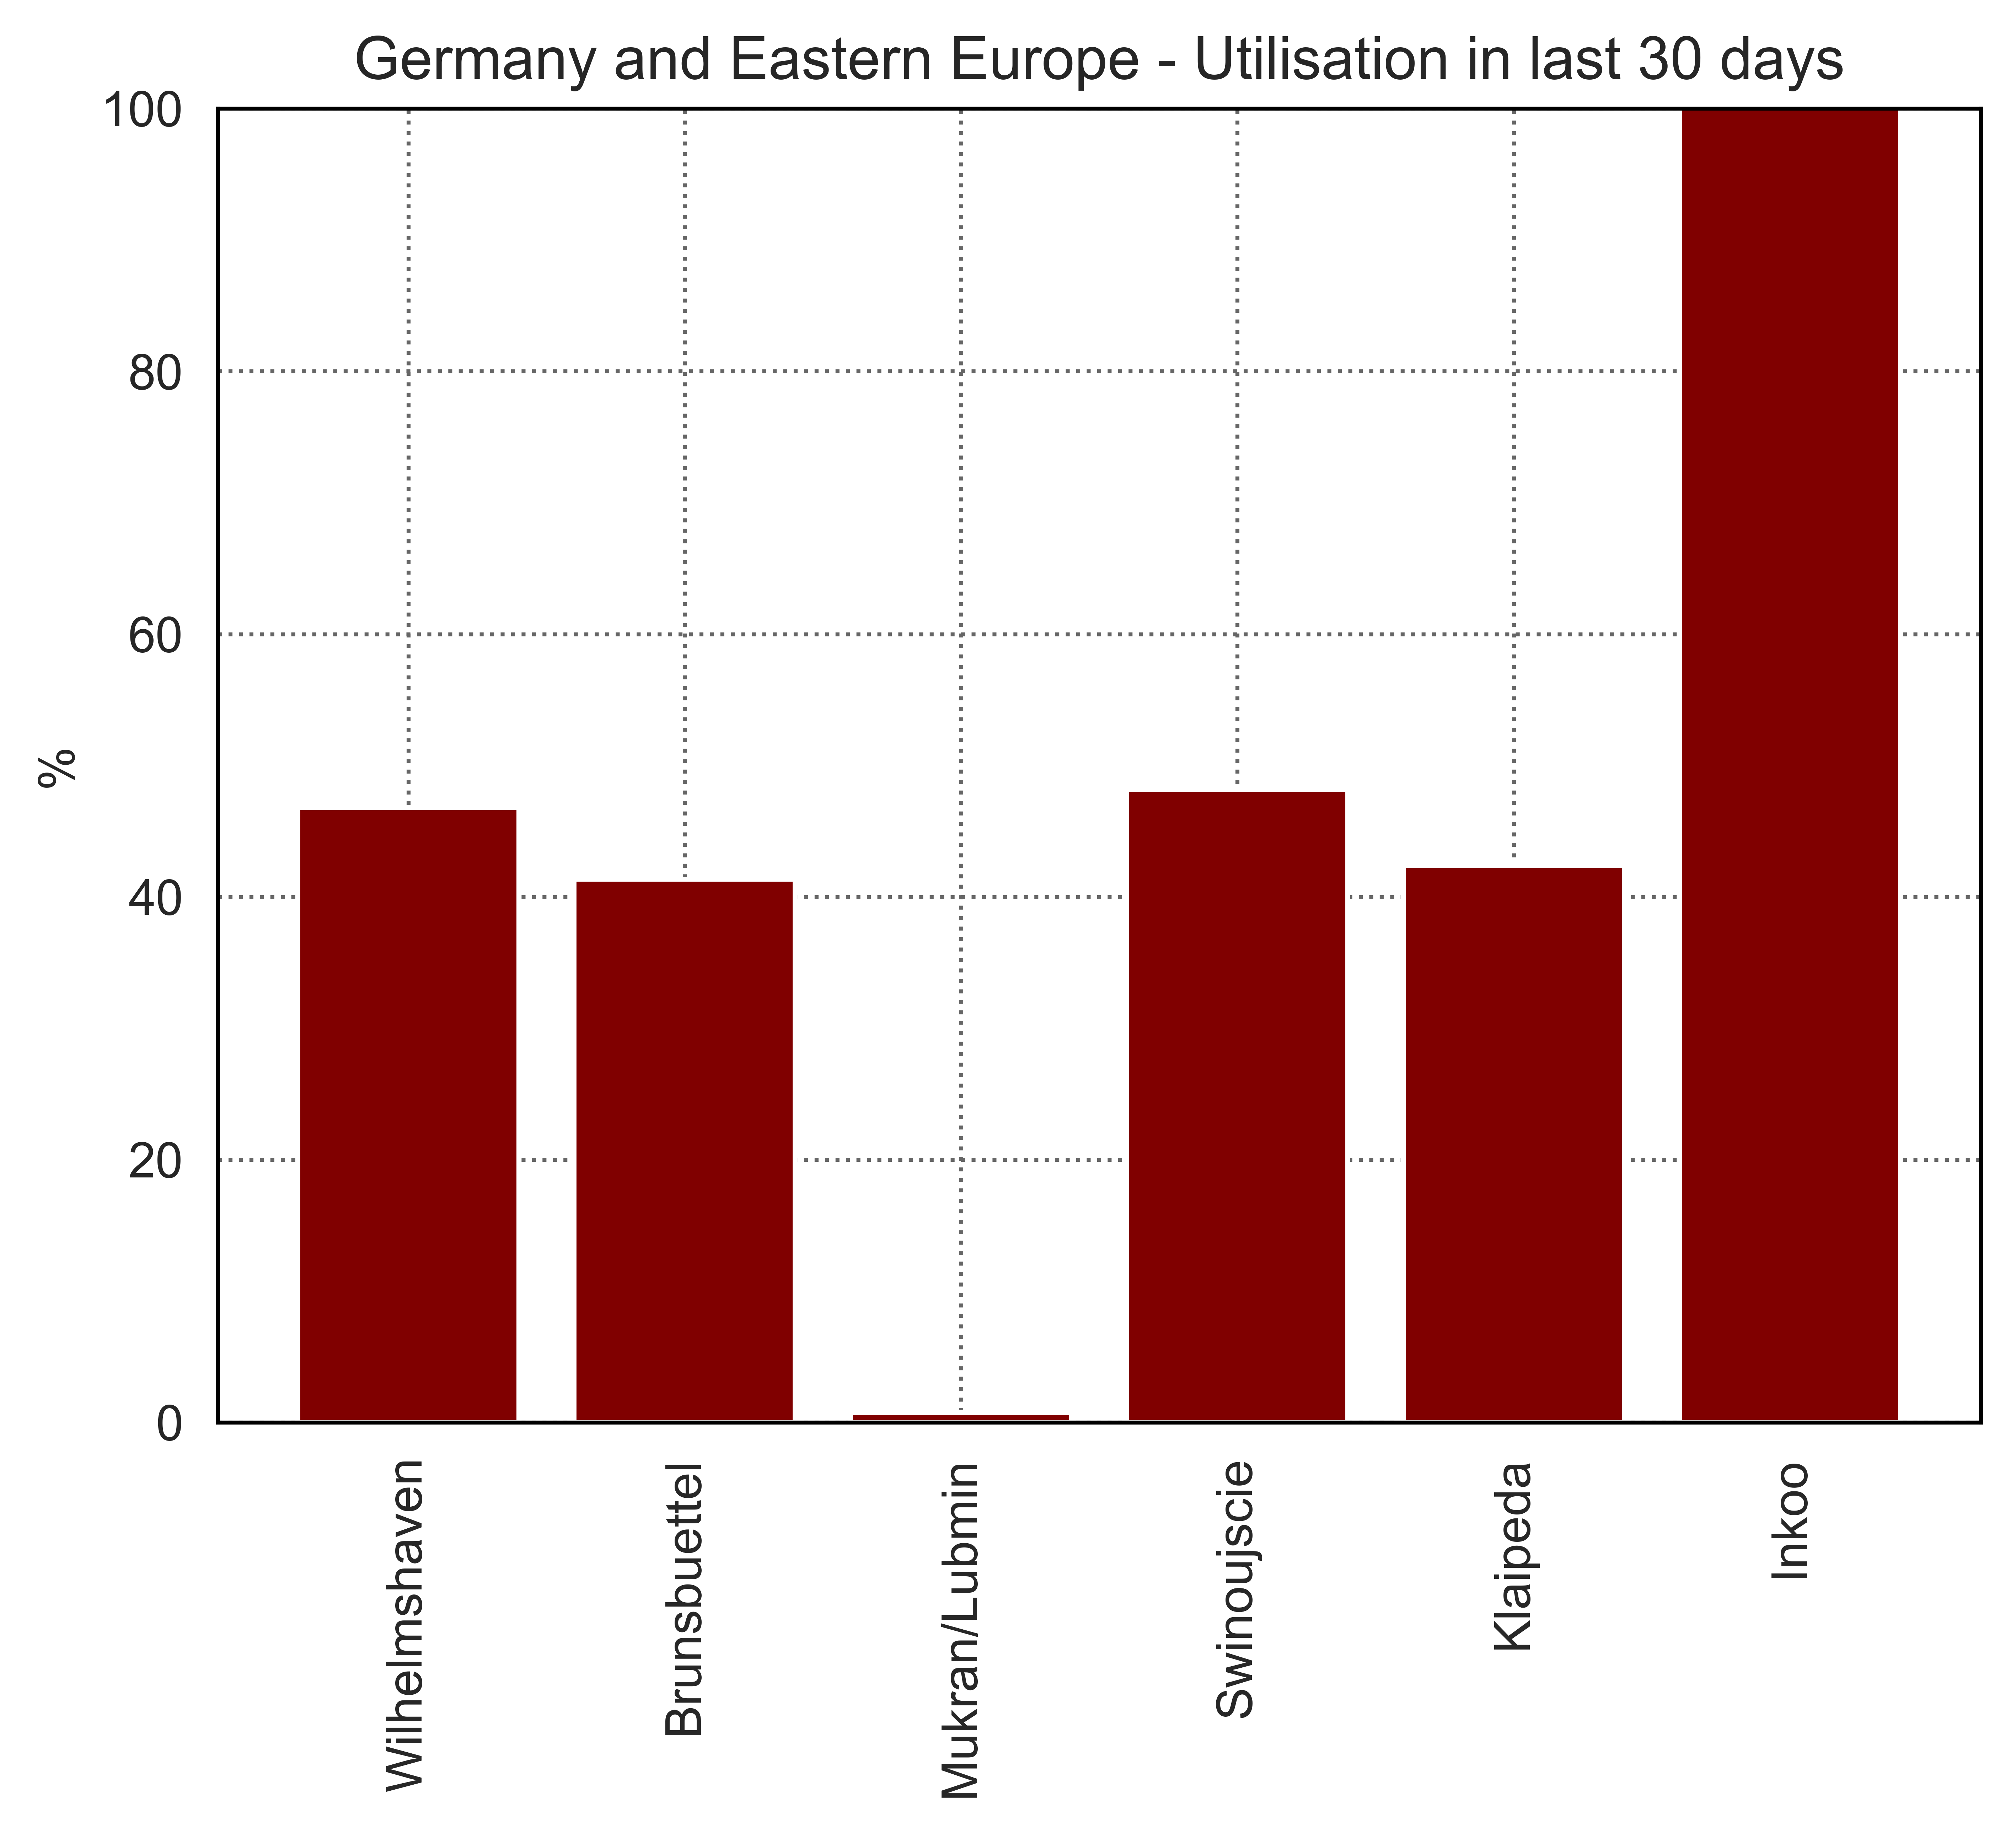
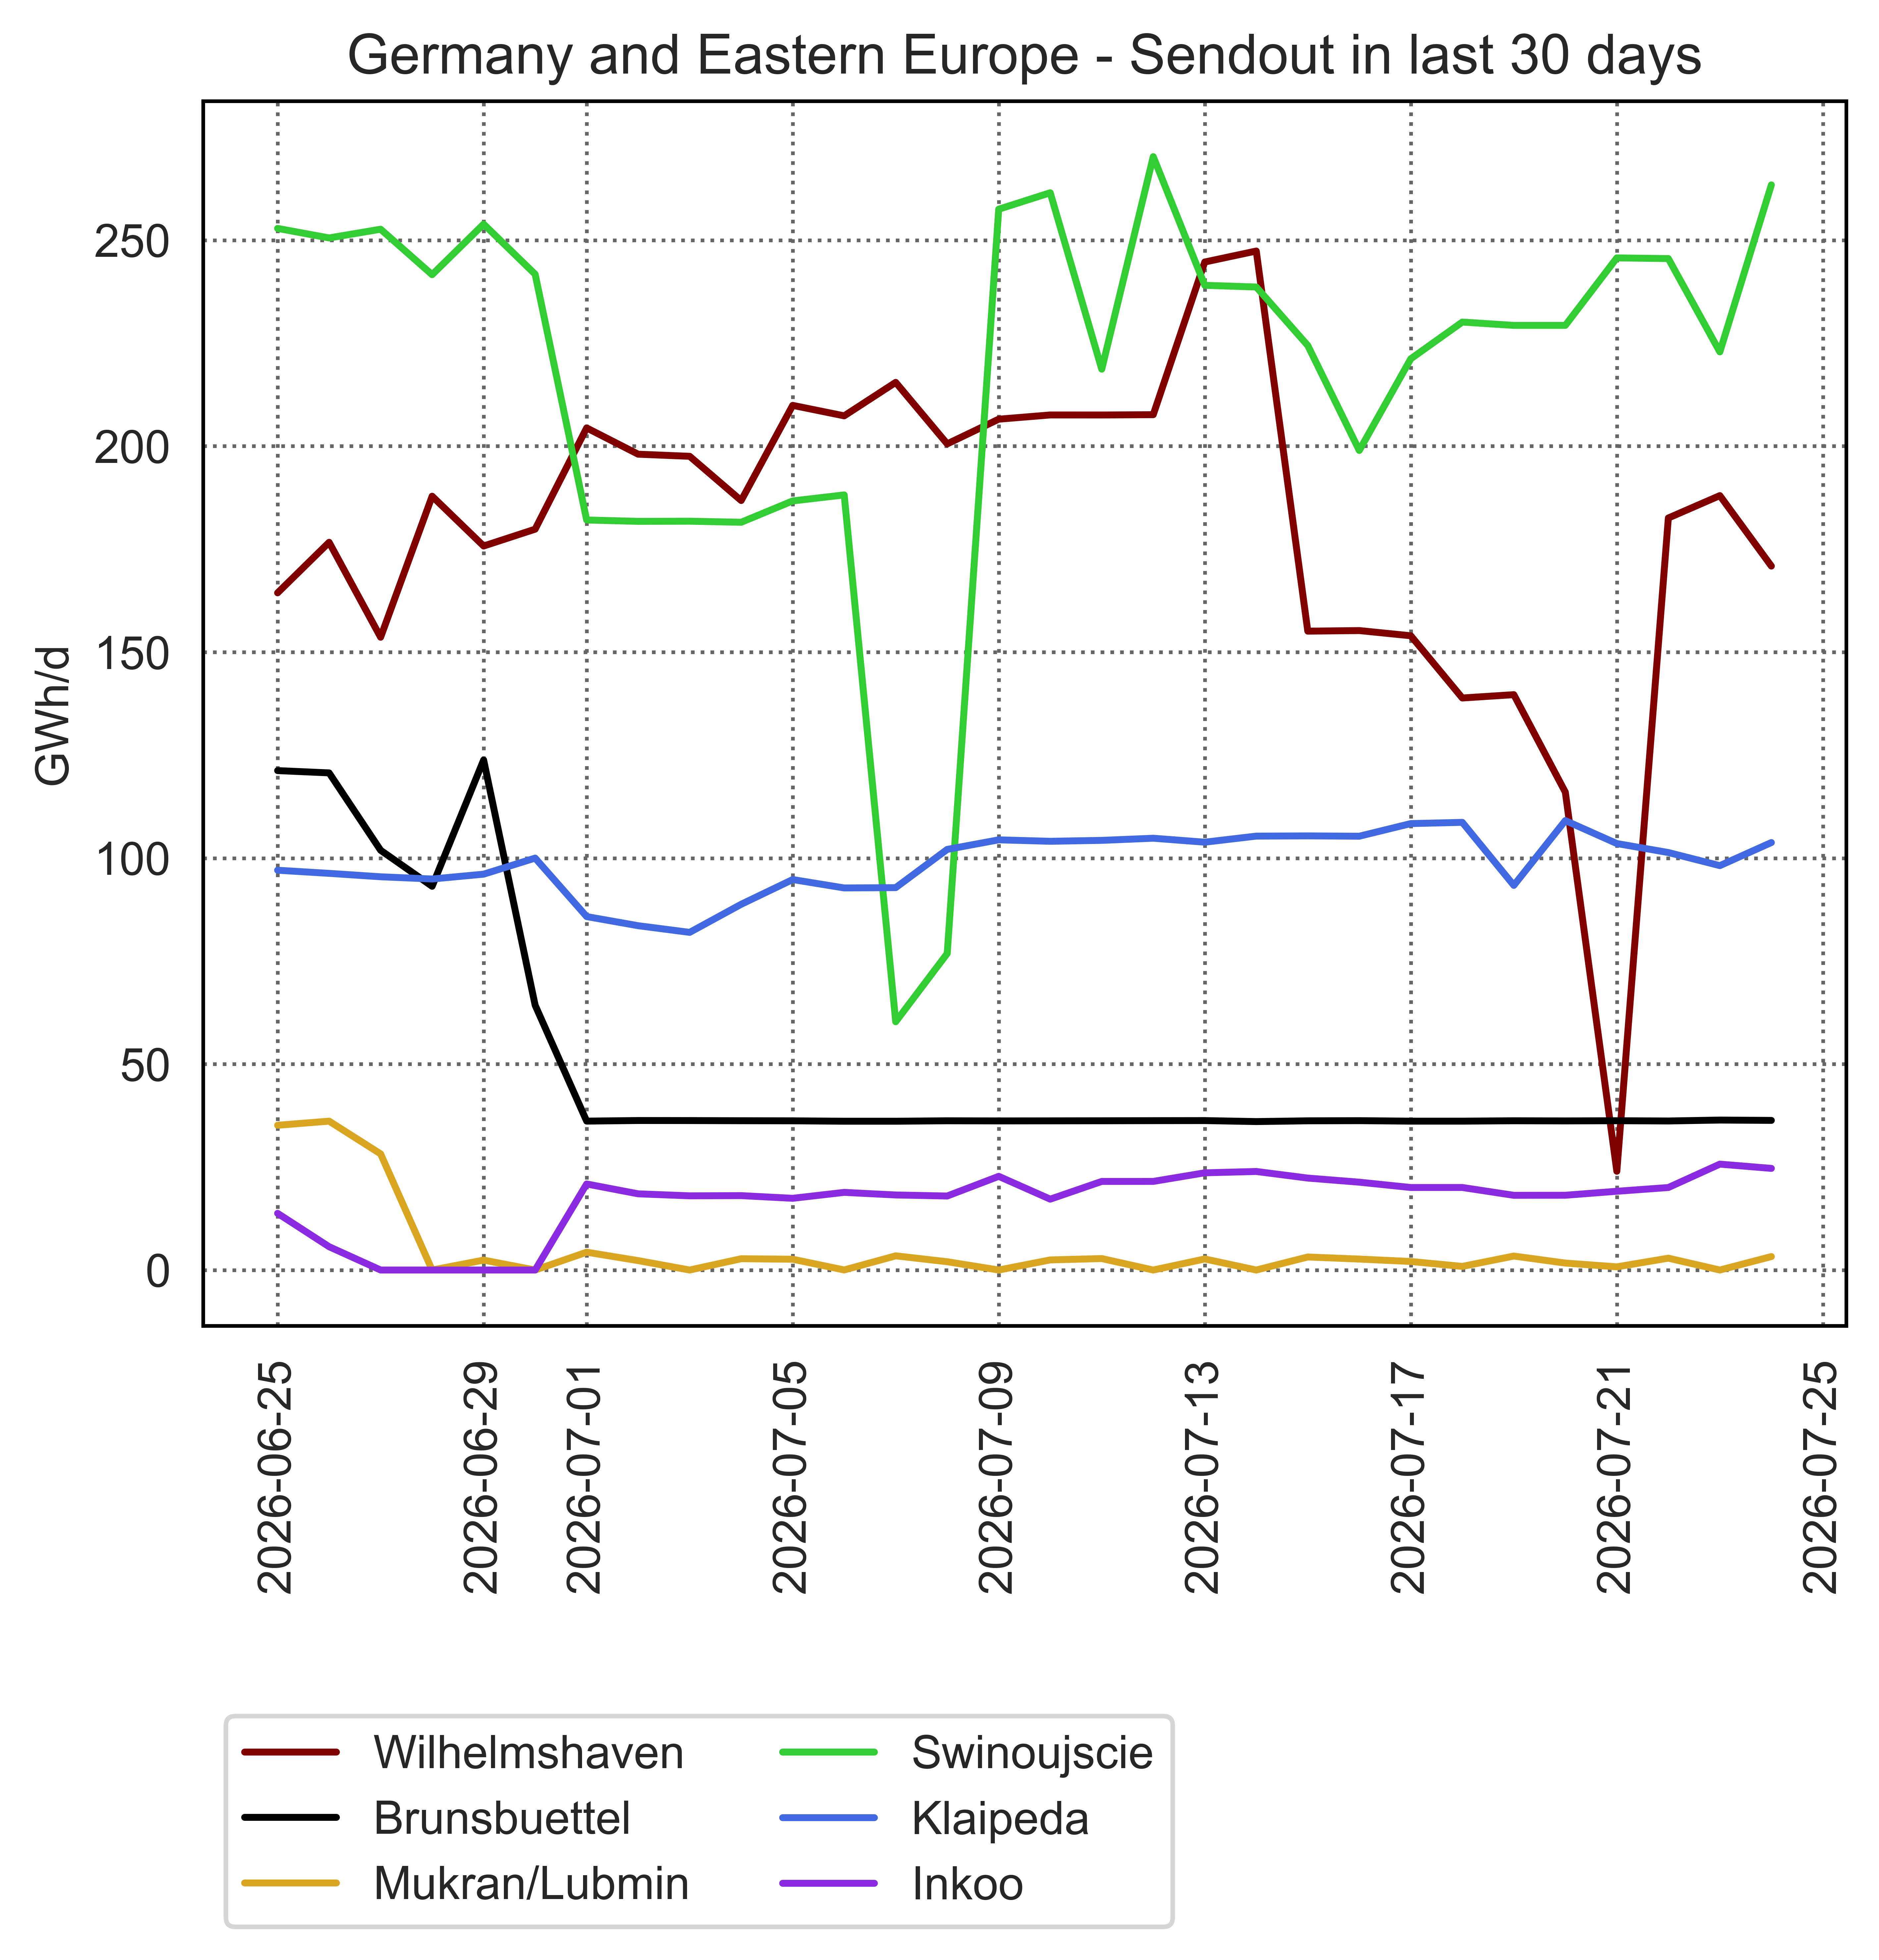
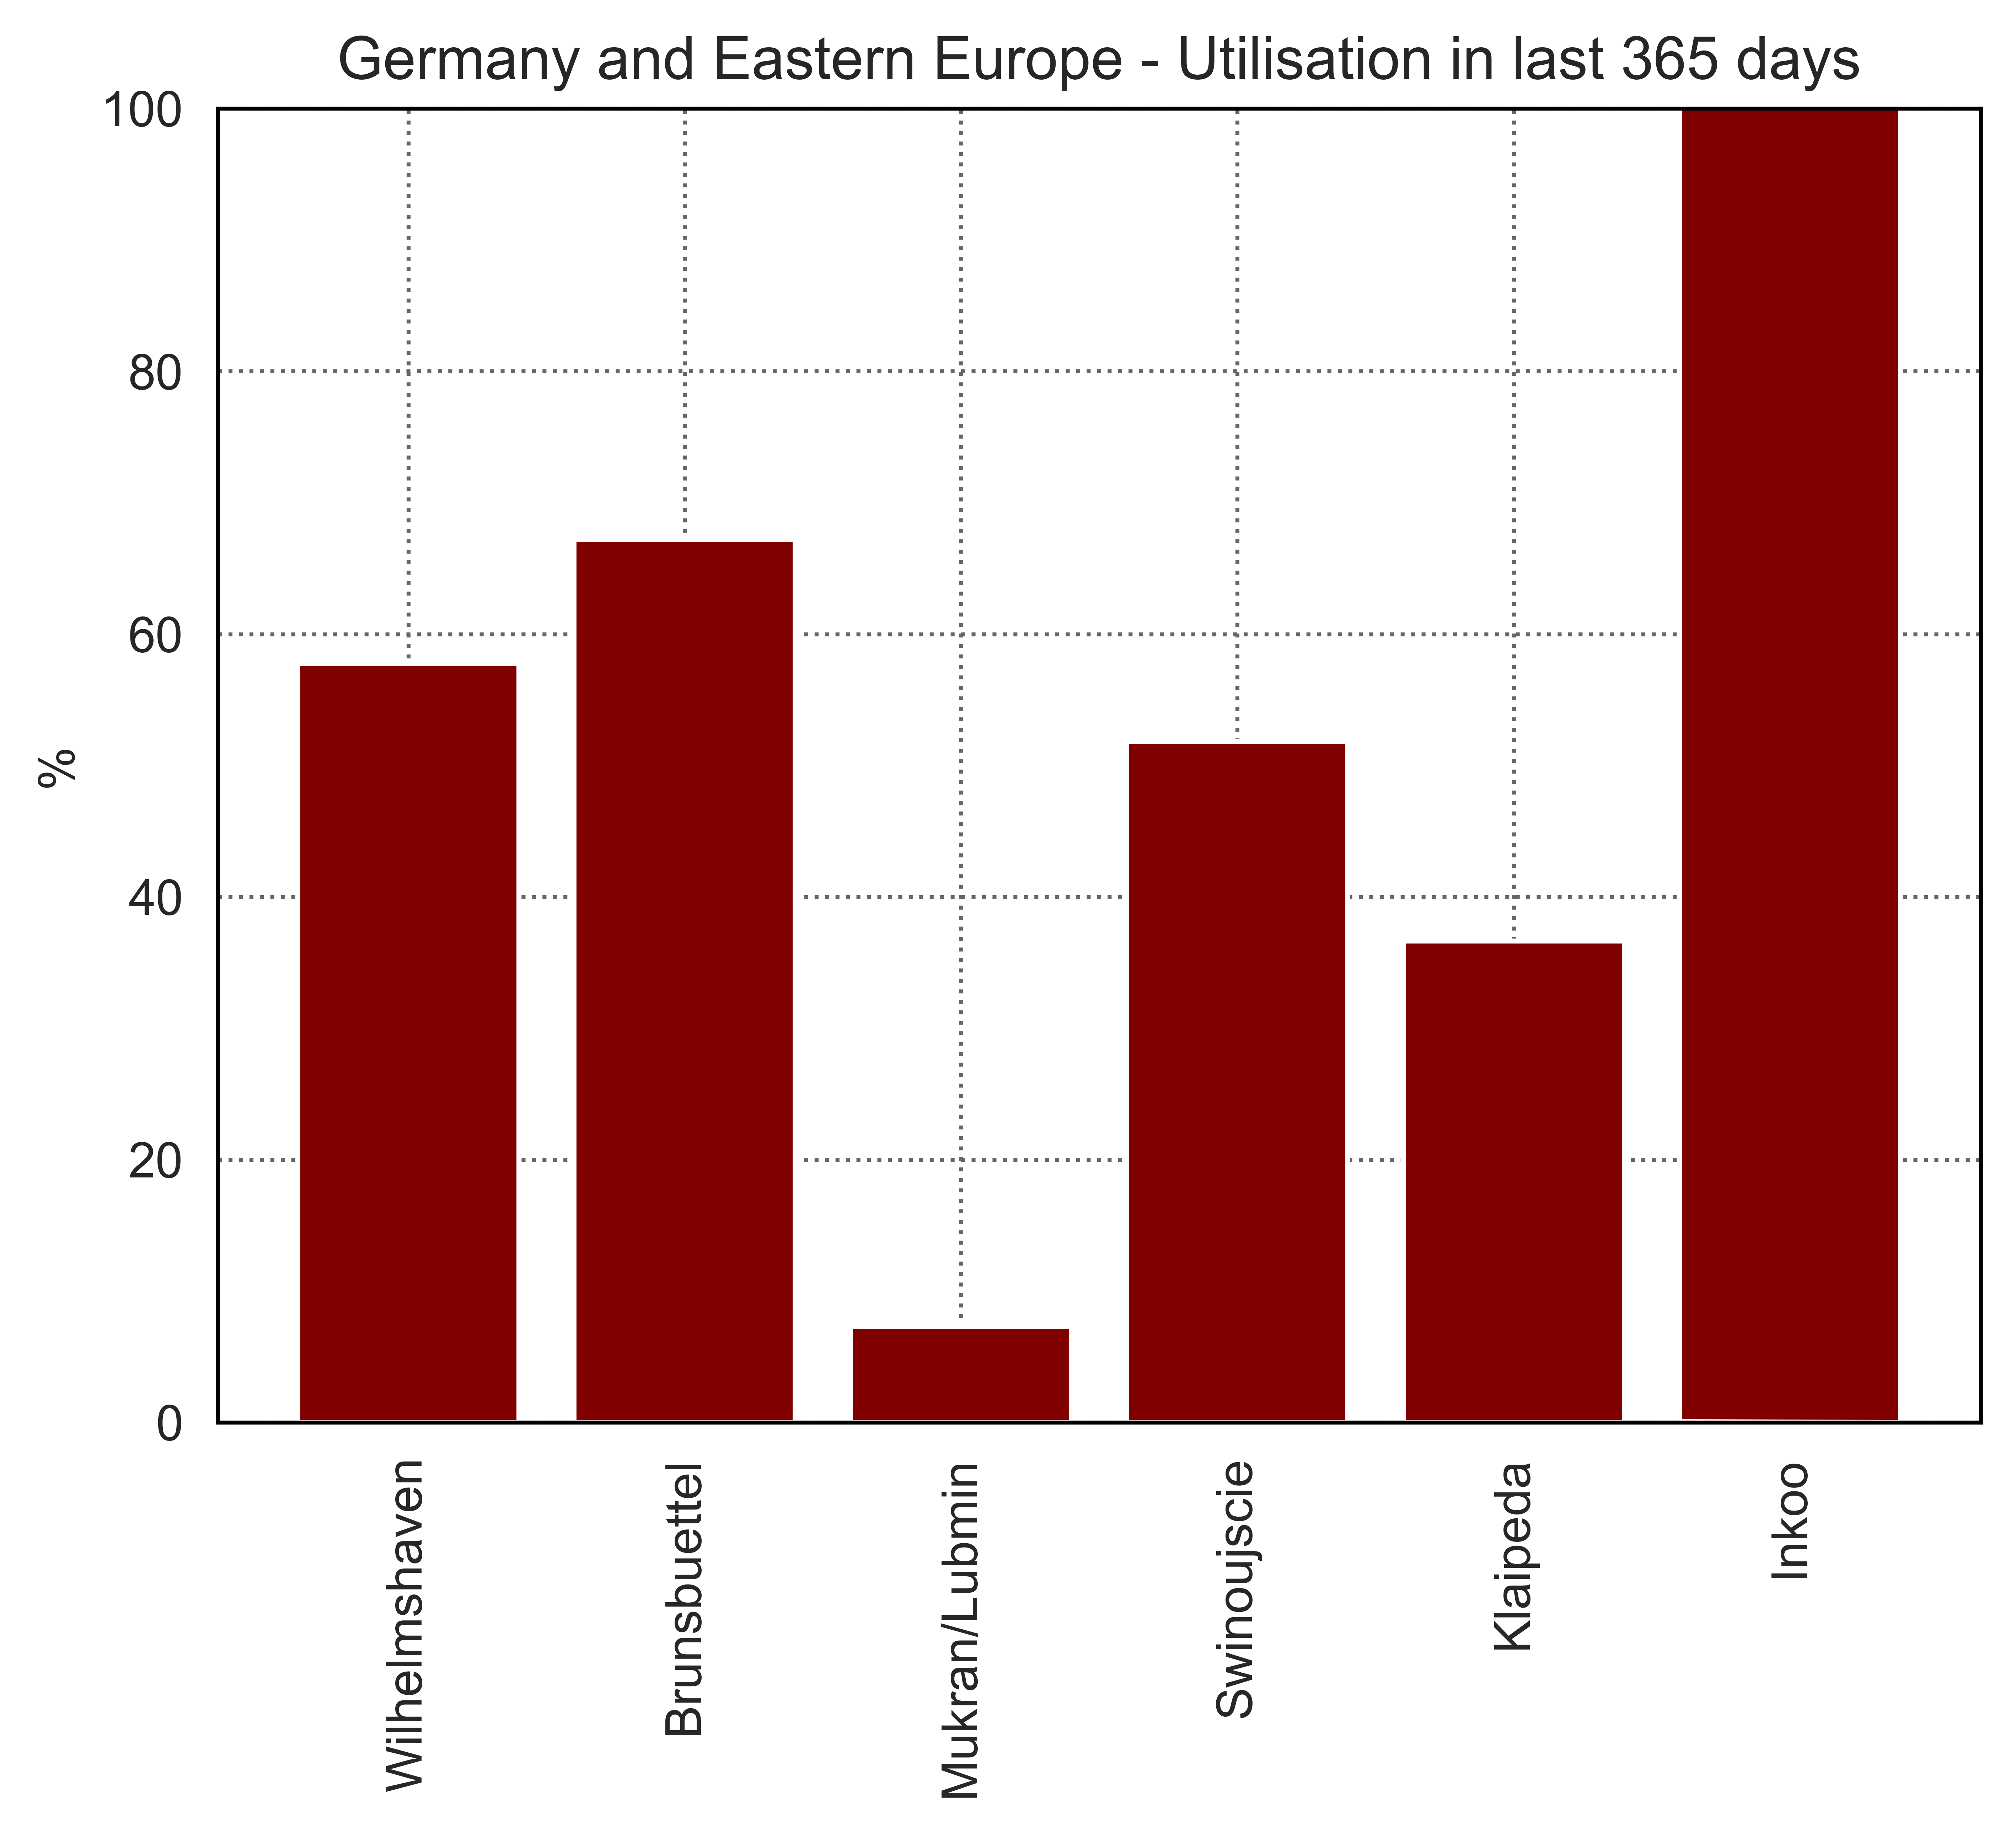
This page shows data on the utilisation of individual European LNG terminals in the last 30 and 365 days, as well as recent sendout data.
Note that the utilisation percentage is calculated based on published sendout capacity figures, and therefore does not measure periods of planned and unplanned reductions in availability of capacity as periods of having lower utilisation.
Source: ENTSOG Transparency Platform